When Microsoft Teams reached the total of 75M active daily users in May it was a huge milestone proving that Teams was truly the key collaboration tool for the Microsoft 365 cloud service. Microsoft has declared Teams their fastest-growing enterprise application ever. Microsoft 365 corporate vice president, Jared Spataro, called it an “inflection point” and said “we’re never going to go back to working the way we did. We’re going to look back and realize that this is when it all changed.”
For many organizations, Teams fills an essential gap for group communication and collaboration, an area where previous tools have fallen short. Now with over half a million organizations using Teams, and active users driving over 900 million minutes of weekly calls and meetings, customers are asking for methods to better understand how Teams is being used compared with E-Mail (Outlook / Exchange), SharePoint and Skype for Business.
So, how are people really using Teams? Or who’s NOT using Teams at all?
Teams has proven that it can solve business problems and help groups communicate, collaborate and coordinate activities. But only for those users who get involved and properly use the capabilities.
We have talked to over a hundred organizations this year alone, and some of the patterns we found are:
- Most IT organizations are struggling to keep the lights on, and they are much less restrictive than usual about letting people create new Teams or continue to use Skype for Business.
- As organizations were transitioning from Skype for Business to Teams, some departments got caught by surprise during the pandemic and are in coexistence mode with little oversight of how their usage continues.
- The majority of the organizations were facing a ‘sink or swim’ situation with a sudden shift to a work from home model and little time for proper adoption & training programs to support Teams.
These situations are tricky, because the standard reporting tools in M365 focus on the number of active users per workload (whether Teams or SharePoint or even Skype for Business) but provide little insight into how people are using them. Not to mention that within the Teams Admin center, the adoption metrics listed only store 28 days of usage which makes it impossible to identify trends, and they only include the active users. For IT groups focused on driving adoption and change management they need to know which people are NOT leveraging Teams, and if they don’t use it, they want to know what they are using instead. A recent blog on our website describes how the OfficeExpert solution provides that information to drive targeted adoption campaigns effectively.
Comparing Teams Usage with other Workloads
An additional source of Teams activity information comes from the M365 usage reports. These offer data up to 180 days, but once again they do not list the inactive users and they provide no cross-comparison capabilities to showcase how the different workloads are being utilized to communicate and collaborate. The organizations we have met with over the past year have been unanimous about comparative analytics. They want to know the truth. They want better visibility into what users are doing inside the M365 cloud so they can compare how the momentum of Teams adoption is changing user behavior to help groups communicate, collaborate and coordinate.
Building your own application to analyze Microsoft 365 usage data
The OfficeExpert solution uses all available API’s and data access methods from Microsoft to extract the valuable usage information from M365. Any organization can build this type of data analytics solution, given the time. These are the three components you will need to develop:
- A scalable data warehouse that can store your aggregated usage data over time.
- A mechanism that collects all relevant usage data from the appropriate APIs (i.e. the Microsoft Graph API) and then organizes it so that your workload usage is accessible per user.
- An intuitive web application and user interface that provides Reports, Visualizations, and Actionable Details to make sense of the huge amount of data customers are generating.
We have been developing the OfficeExpert solution for over 4 years and have implemented features from customers around the world. From our discussions with enterprise organizations who have tried to build a similar type of application the average design to deployment time estimated was over 9-months.
The OfficeExpert Solution Benefits for Tracking Adoption Trends
OfficeExpert extracts all usage activity information from M365 workloads and stores it for as long as you want so you can analyze trends over a year or more. The data is aggregated and combined with valuable user attributes from Azure AD to provide actionable intelligence for both IT administrators and other groups that are tasked with driving digital transformation initiatives to help employees work smarter. With this information at their fingertips they have a birds-eye view to measure the effectiveness of their training programs and adoption campaigns. Plus, they have a way to monitor the transition away from Skype for Business during its phase-out over the next 14 months.
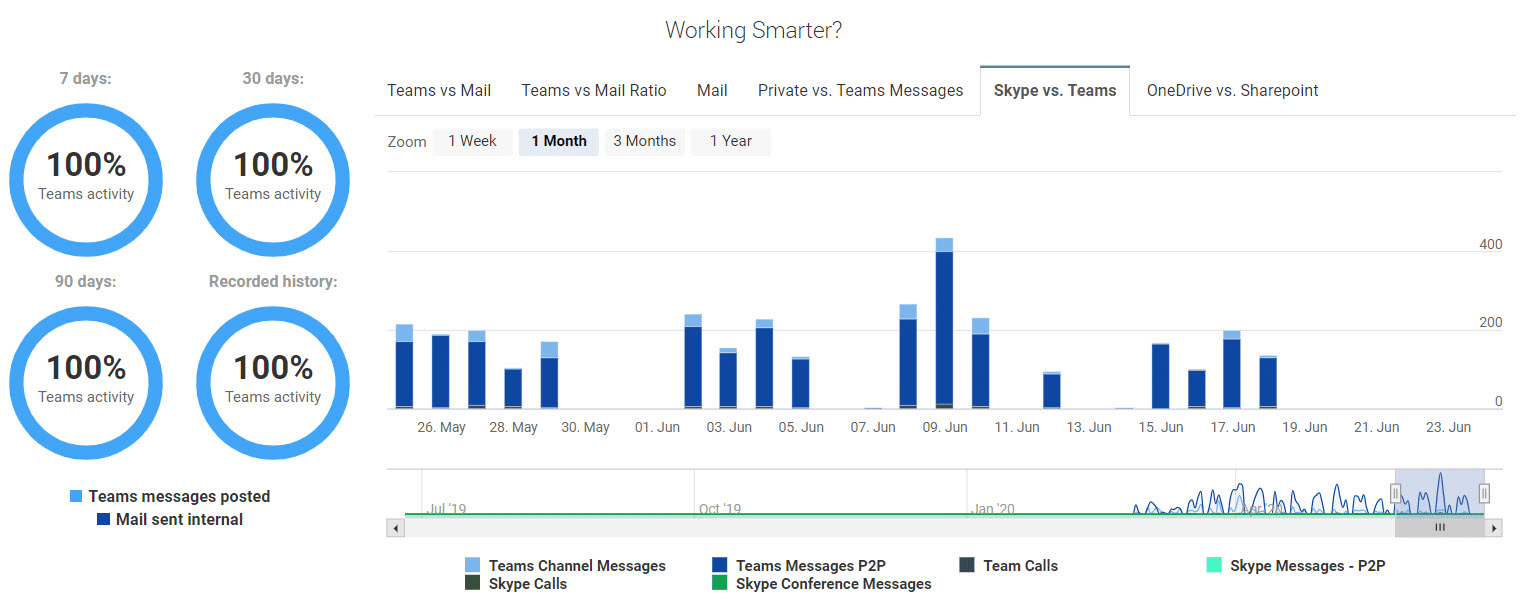
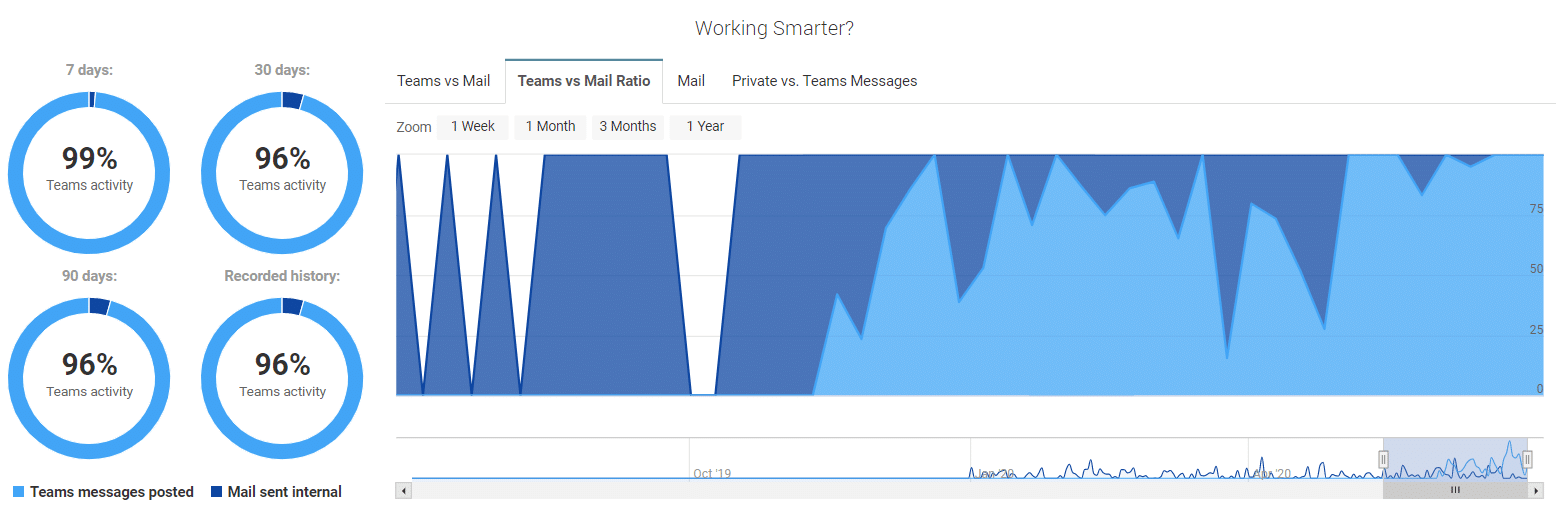
Teams Usage Activity by User
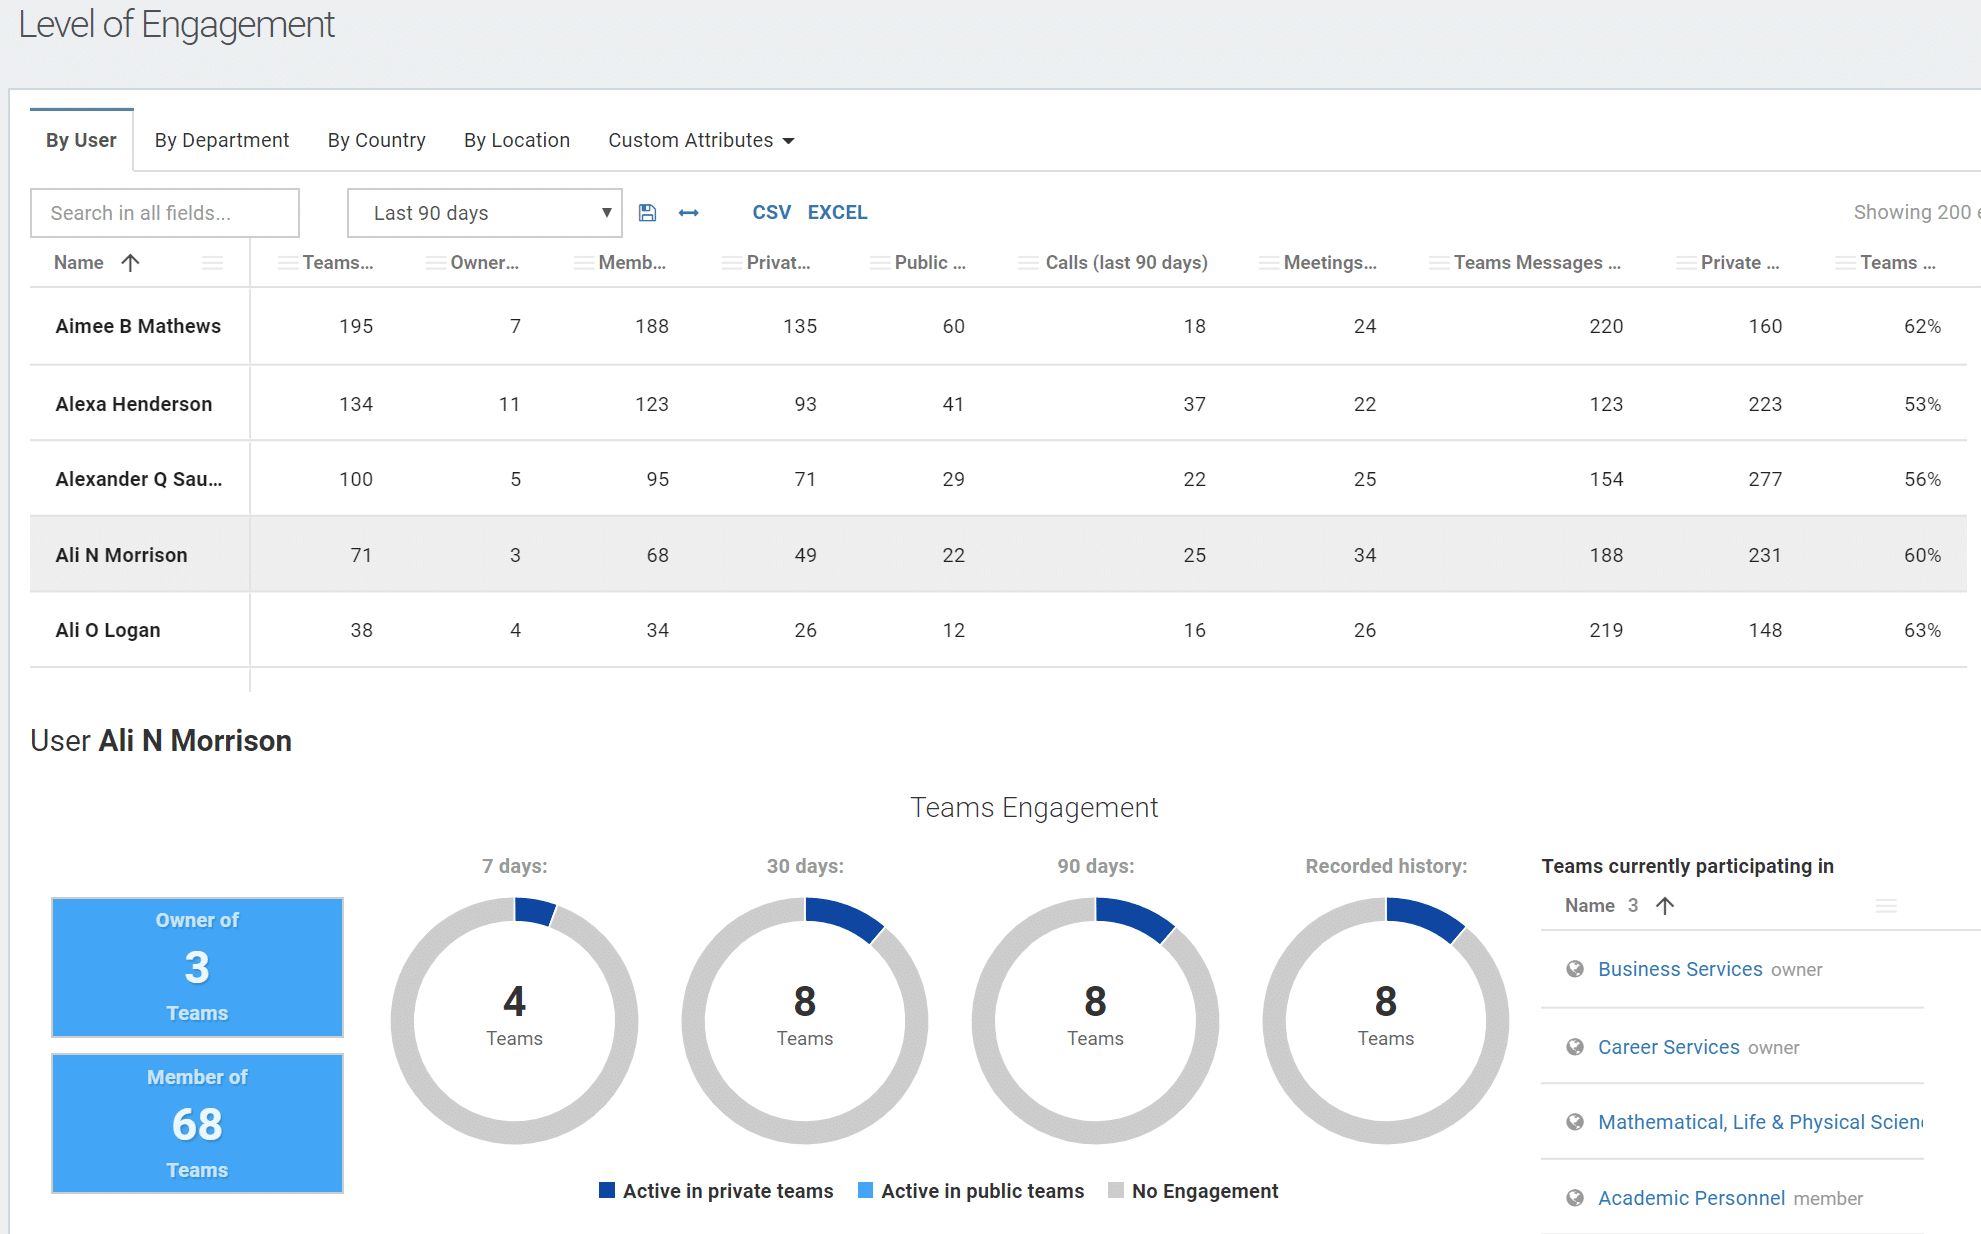
Teams Usage Activity by User
More comparative Analytics coming soon
We are providing more intelligent, comparative reports to answer questions such as:
- How does a specific department, country, or geographic location use Teams vs. Skype?
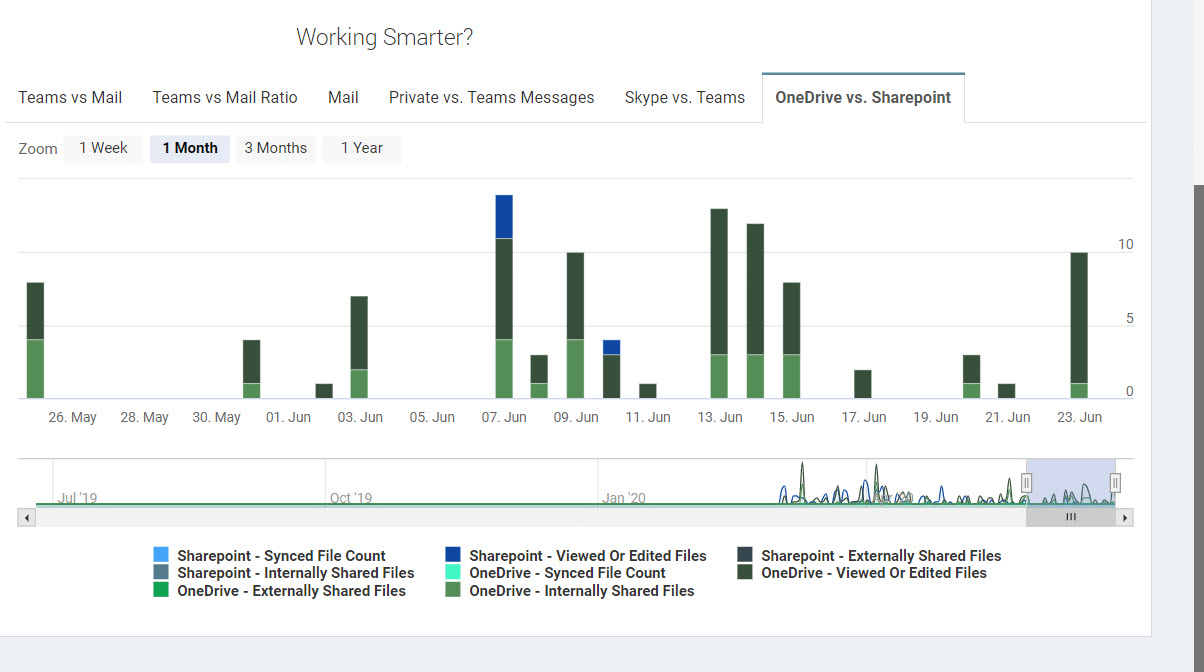
- How do different user groups share files both internally and externally?