
In consulting engagements with enterprise organizations worldwide, especially in a hybrid workplace, we’ve seen repeatedly that customers who experience problems never contact their IT Department for help.
During a recent panagenda webinar, “The Key to Elevate Work-From-Anywhere”, Will McKeon-White from Forrester Research stated that 64% of their survey respondents said they would avoid the service desk and continue to suffer in silence with ongoing performance issues. This puts pressure on IT operations to proactively look for productivity glitches, identify these users and address those problems that are having a negative impact.
End-to-End Data at IT’s Fingertips
With a digital experience monitoring solution like panagenda OfficeExpert, IT helpdesks can gain the needed visibility into their users’ end-to-end experience. panagenda OfficeExpert is an end-user digital experience monitoring software solution which spotlights how employees and their devices, applications and networks function together. It also provides the telemetry data needed to effect positive change.
OfficeExpert doesn’t just emulate or estimate performance. Rather it measures what occurs on the user endpoints during their daily tasks — whether that’s document downloads, streaming internal videos, or participating in Microsoft Teams calls.
Sometimes, IT Can Get Personal
You are in a call online with your colleague or a customer. Suddenly, the audio gets choppy, your video freezes; your colleague or worse, your customer can’t hear you. Now imagine this happening day after day. What’s worse, your ability to support your customers severely degrades. Your company’s reputation starts to take a hit. Sound familiar? This was the reality of my daily work for MONTHS.
As a Technical Consultant working in a hybrid workplace, I spend my days in Microsoft Teams calls with customers helping them to deploy software solutions, troubleshooting their environments, and illustrating how they can get the data they need to solve their problems.
So, when suddenly last October I began experiencing terrible network performance and poor Microsoft Teams calls, I immediately turned to the power of OfficeExpert to analyze, identify, and resolve performance issues that were leaving my productivity in the basement. My Microsoft Teams calls would drop out of the blue, my audio was incoherent, the video was choppy, and colleagues and customers couldn’t reliably hear me during meetings. Attempting to use features like remotely controlling a screen? Forget it! My workday quickly became a series of “can you hear me” or “can you see me?”. Visits to the local coffee shop became a necessity just to speak to customers.
Now, Where to Start Looking for the Culprit?
As is often the case in a user’s digital experience journey, especially when working remotely, there are lots of moving parts involved with any interaction with a cloud service. Every layer from the device, through the network, to the cloud, could hold the keys to identifying the smoking gun.
What was the root cause of my hybrid workplace issues? Could I be having hardware issues? Were my processes and open applications impacting my experience? Did I have home networking issues? Was my VPN usage suddenly having an impact on network performance? Or could my ISP provider be the culprit? Every step in the journey needed to be examined and eliminated as a cause from the user’s endpoint all the way to the Microsoft Cloud doorstep.
Using OfficeExpert, let’s dive into the data:
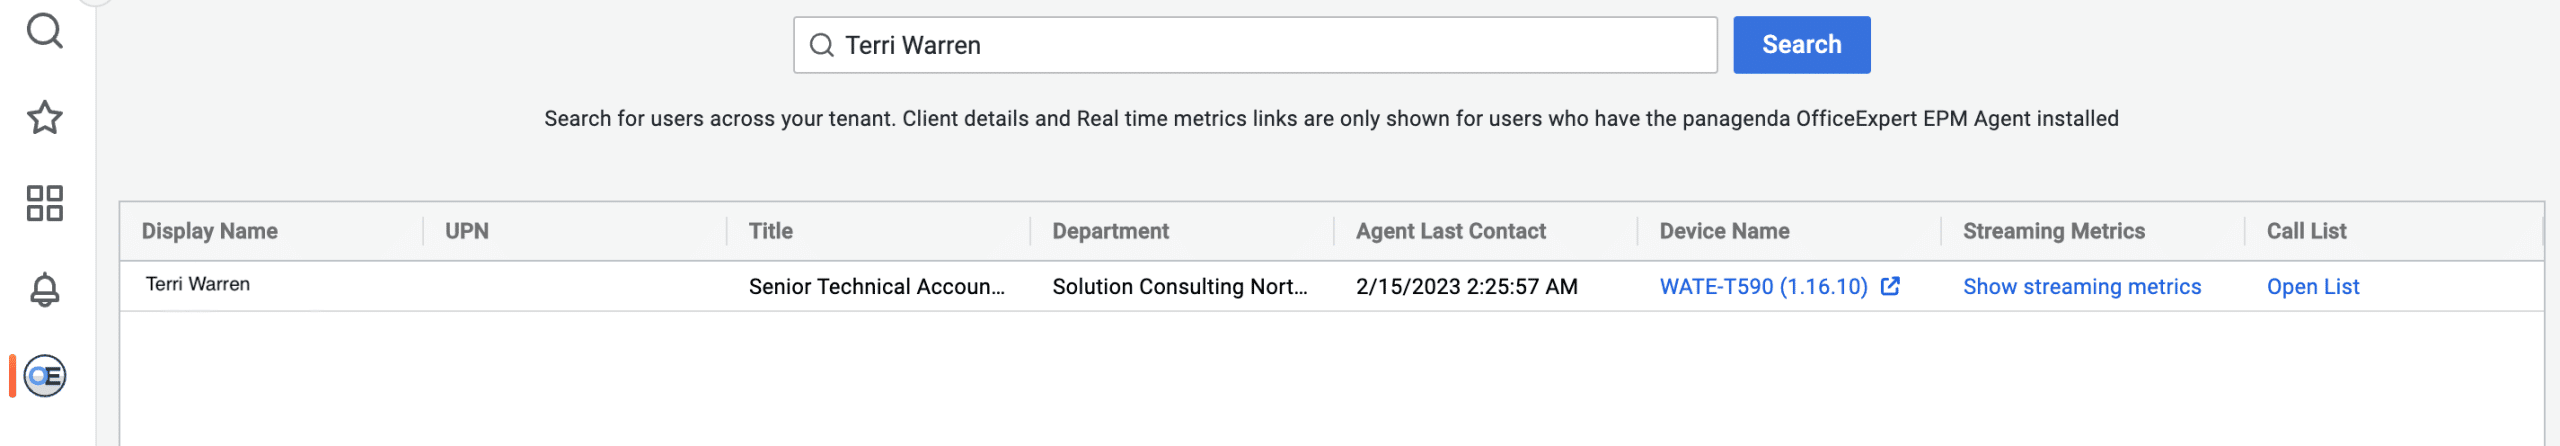
Search for my username and device so we can start our investigation.
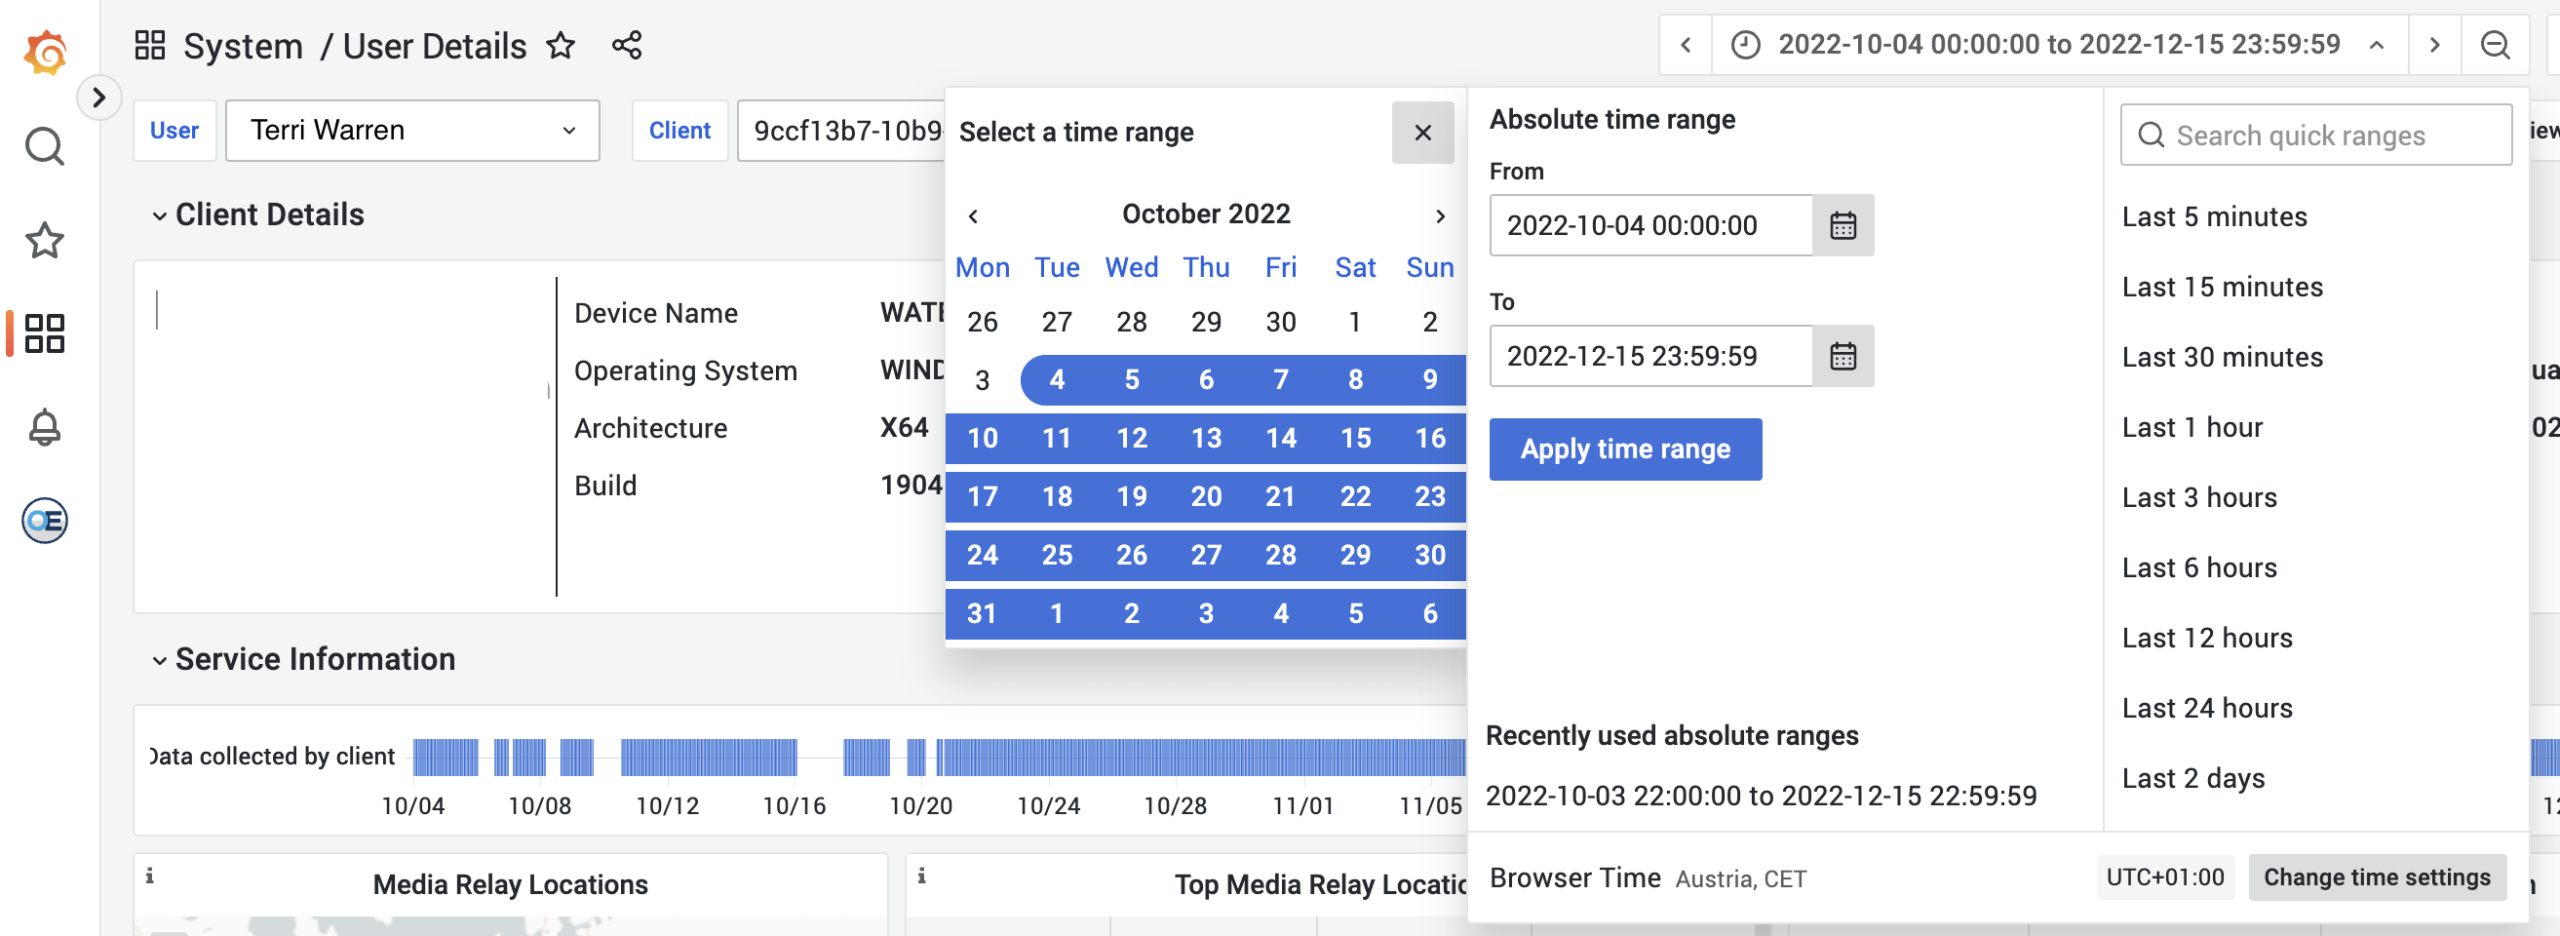
Setting the time window in OfficeExpert for your data search:
Every OfficeExpert dashboard provides the ability to choose the time window to examine data. Data can be searched backwards (the default being 7 days). In this case, the issues were seen consistently between October 4th and December 15th 2022, so that was the time period chosen:
Rounding Up the Suspects
Suspect #1: Computer Capabilities
Working with advanced technology (especially cloud services and in a hybrid workplace) can stretch the limits of processing power, CPU and memory of endpoint devices and this can prove to be a bottleneck. Monitoring these devices and identifying strained resources or legacy software during any given cloud activity is the first place to start.
Using the OfficeExpert Client:
- The “Client Details” panel indicates this device has a 1.80 GHZ CPU 4-core processor with 24 GB of memory.
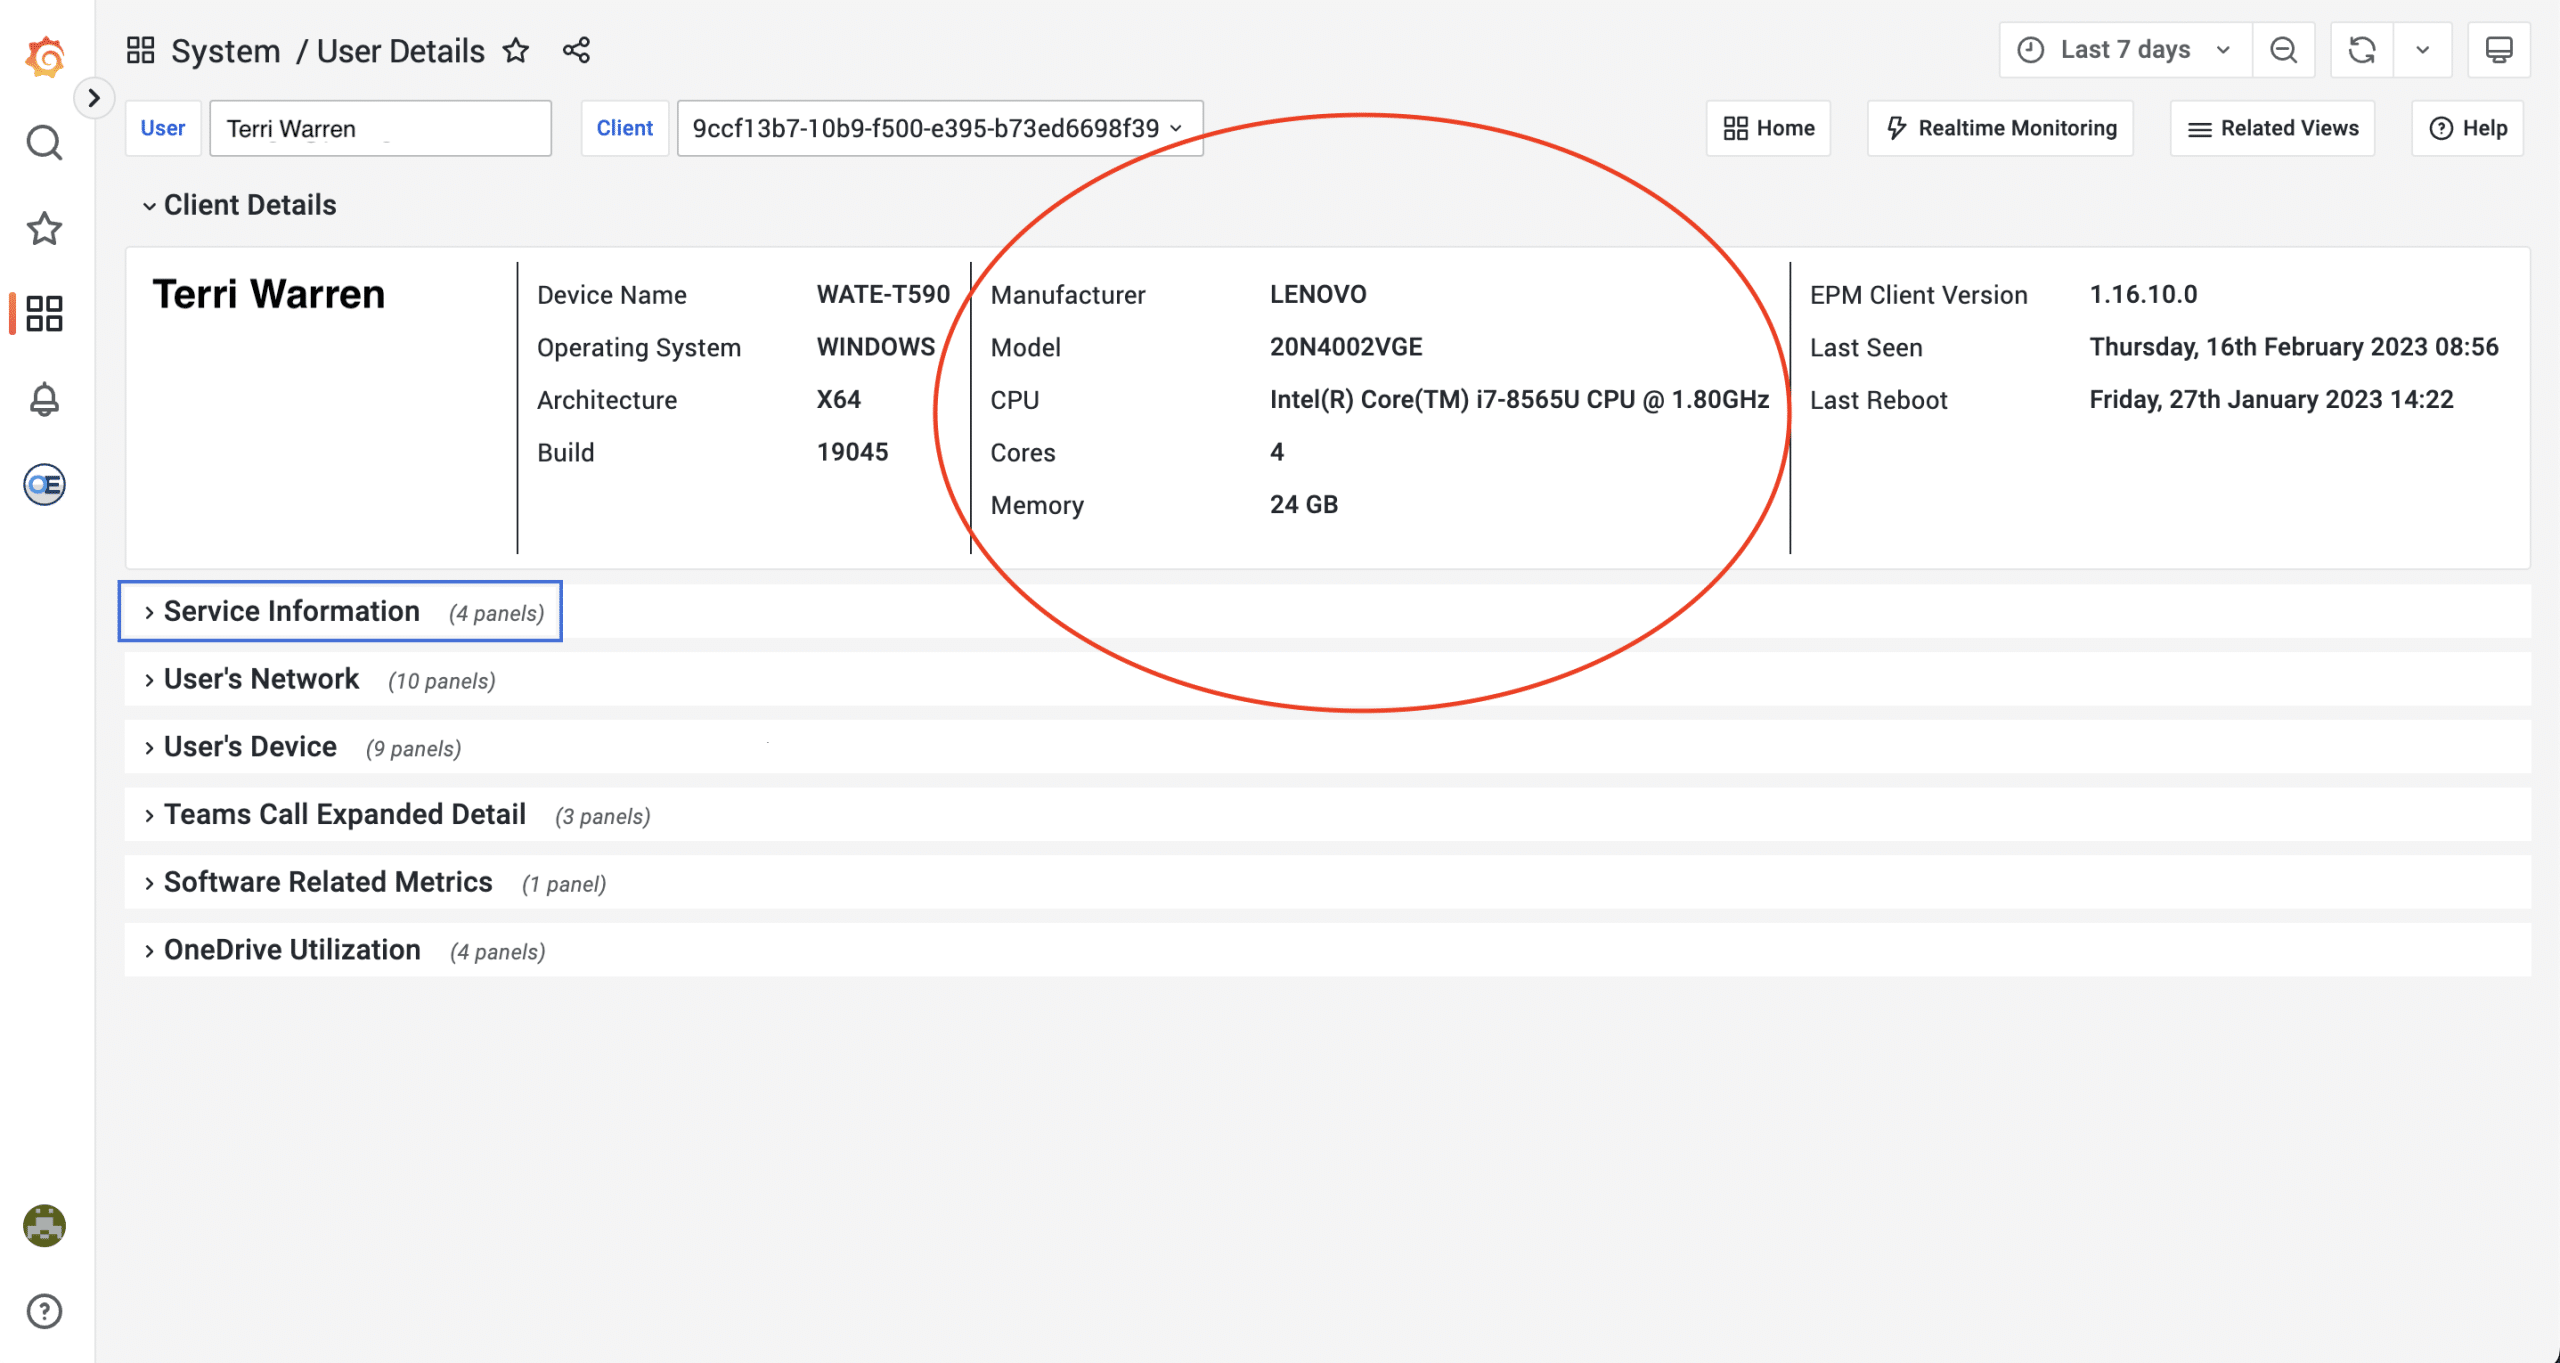
- On the “User Details” page, choose the “User’s Device” panel, to check the CPU, Memory, and Disk.
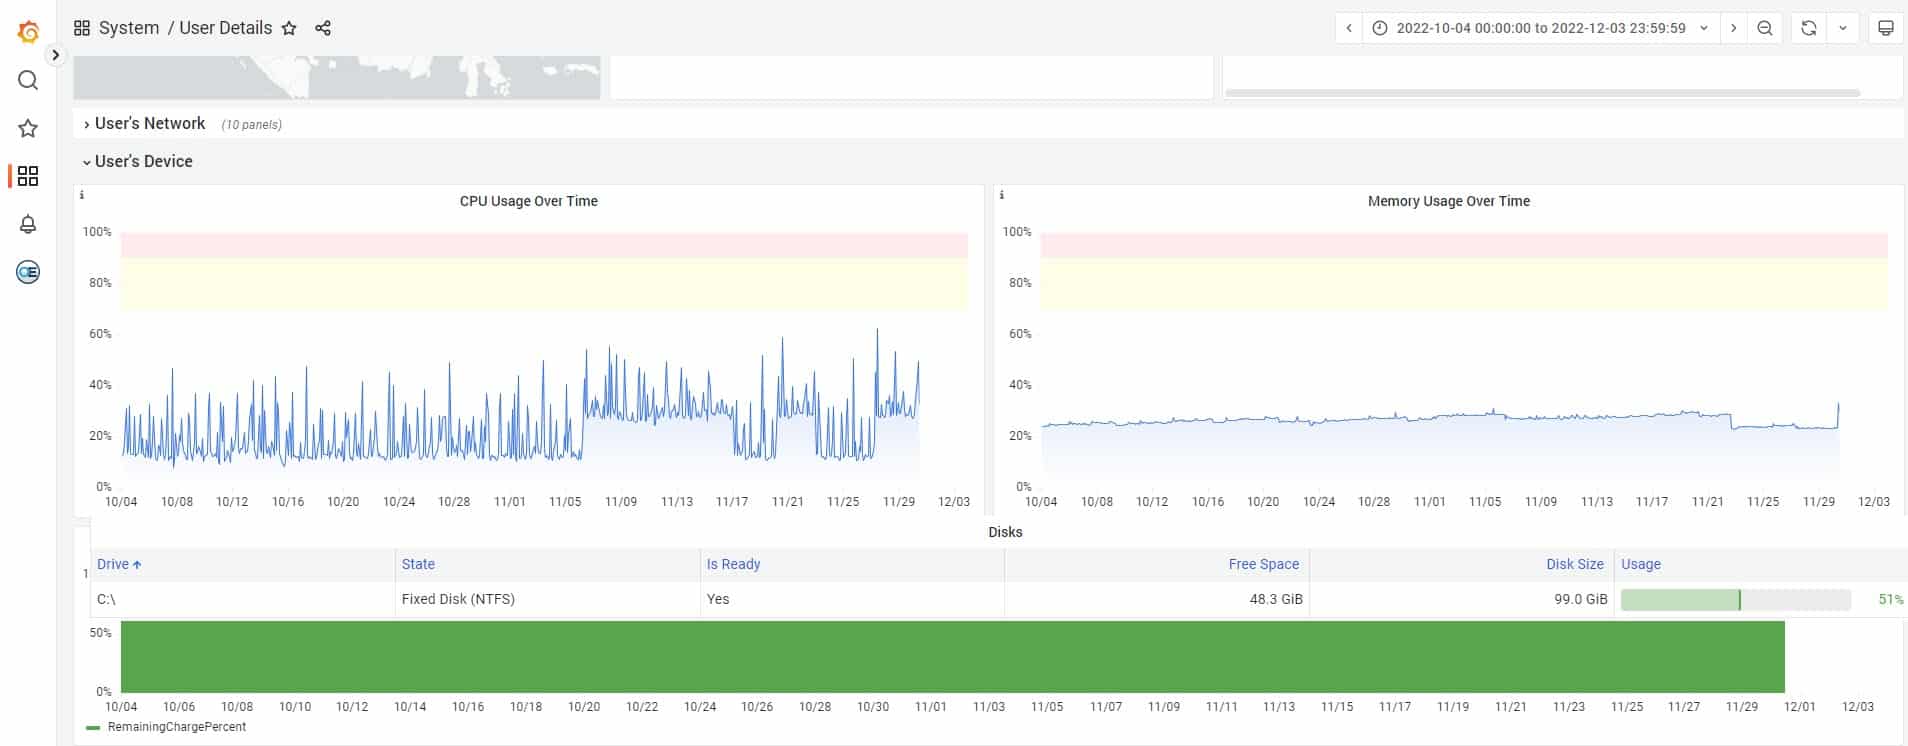
Result: No issues were detected after looking at CPU, Memory, and Disk Space. On to suspect #2!
Suspect #2: Background Processes and Open Applications
Running CPU-heavy applications and processes can have a negative impact on computer resources and the overall digital experience. Background processes such as virus scans could consume CPU and can result in slow performance. Having too many applications open on the computer (browser tabs, Word/PowerPoint/Excel docs, etc.) can cause available memory to be reduced; this can affect the user experience and Microsoft Teams call/video quality — especially when working in a hybrid workplace.
Using the OfficeExpert client:
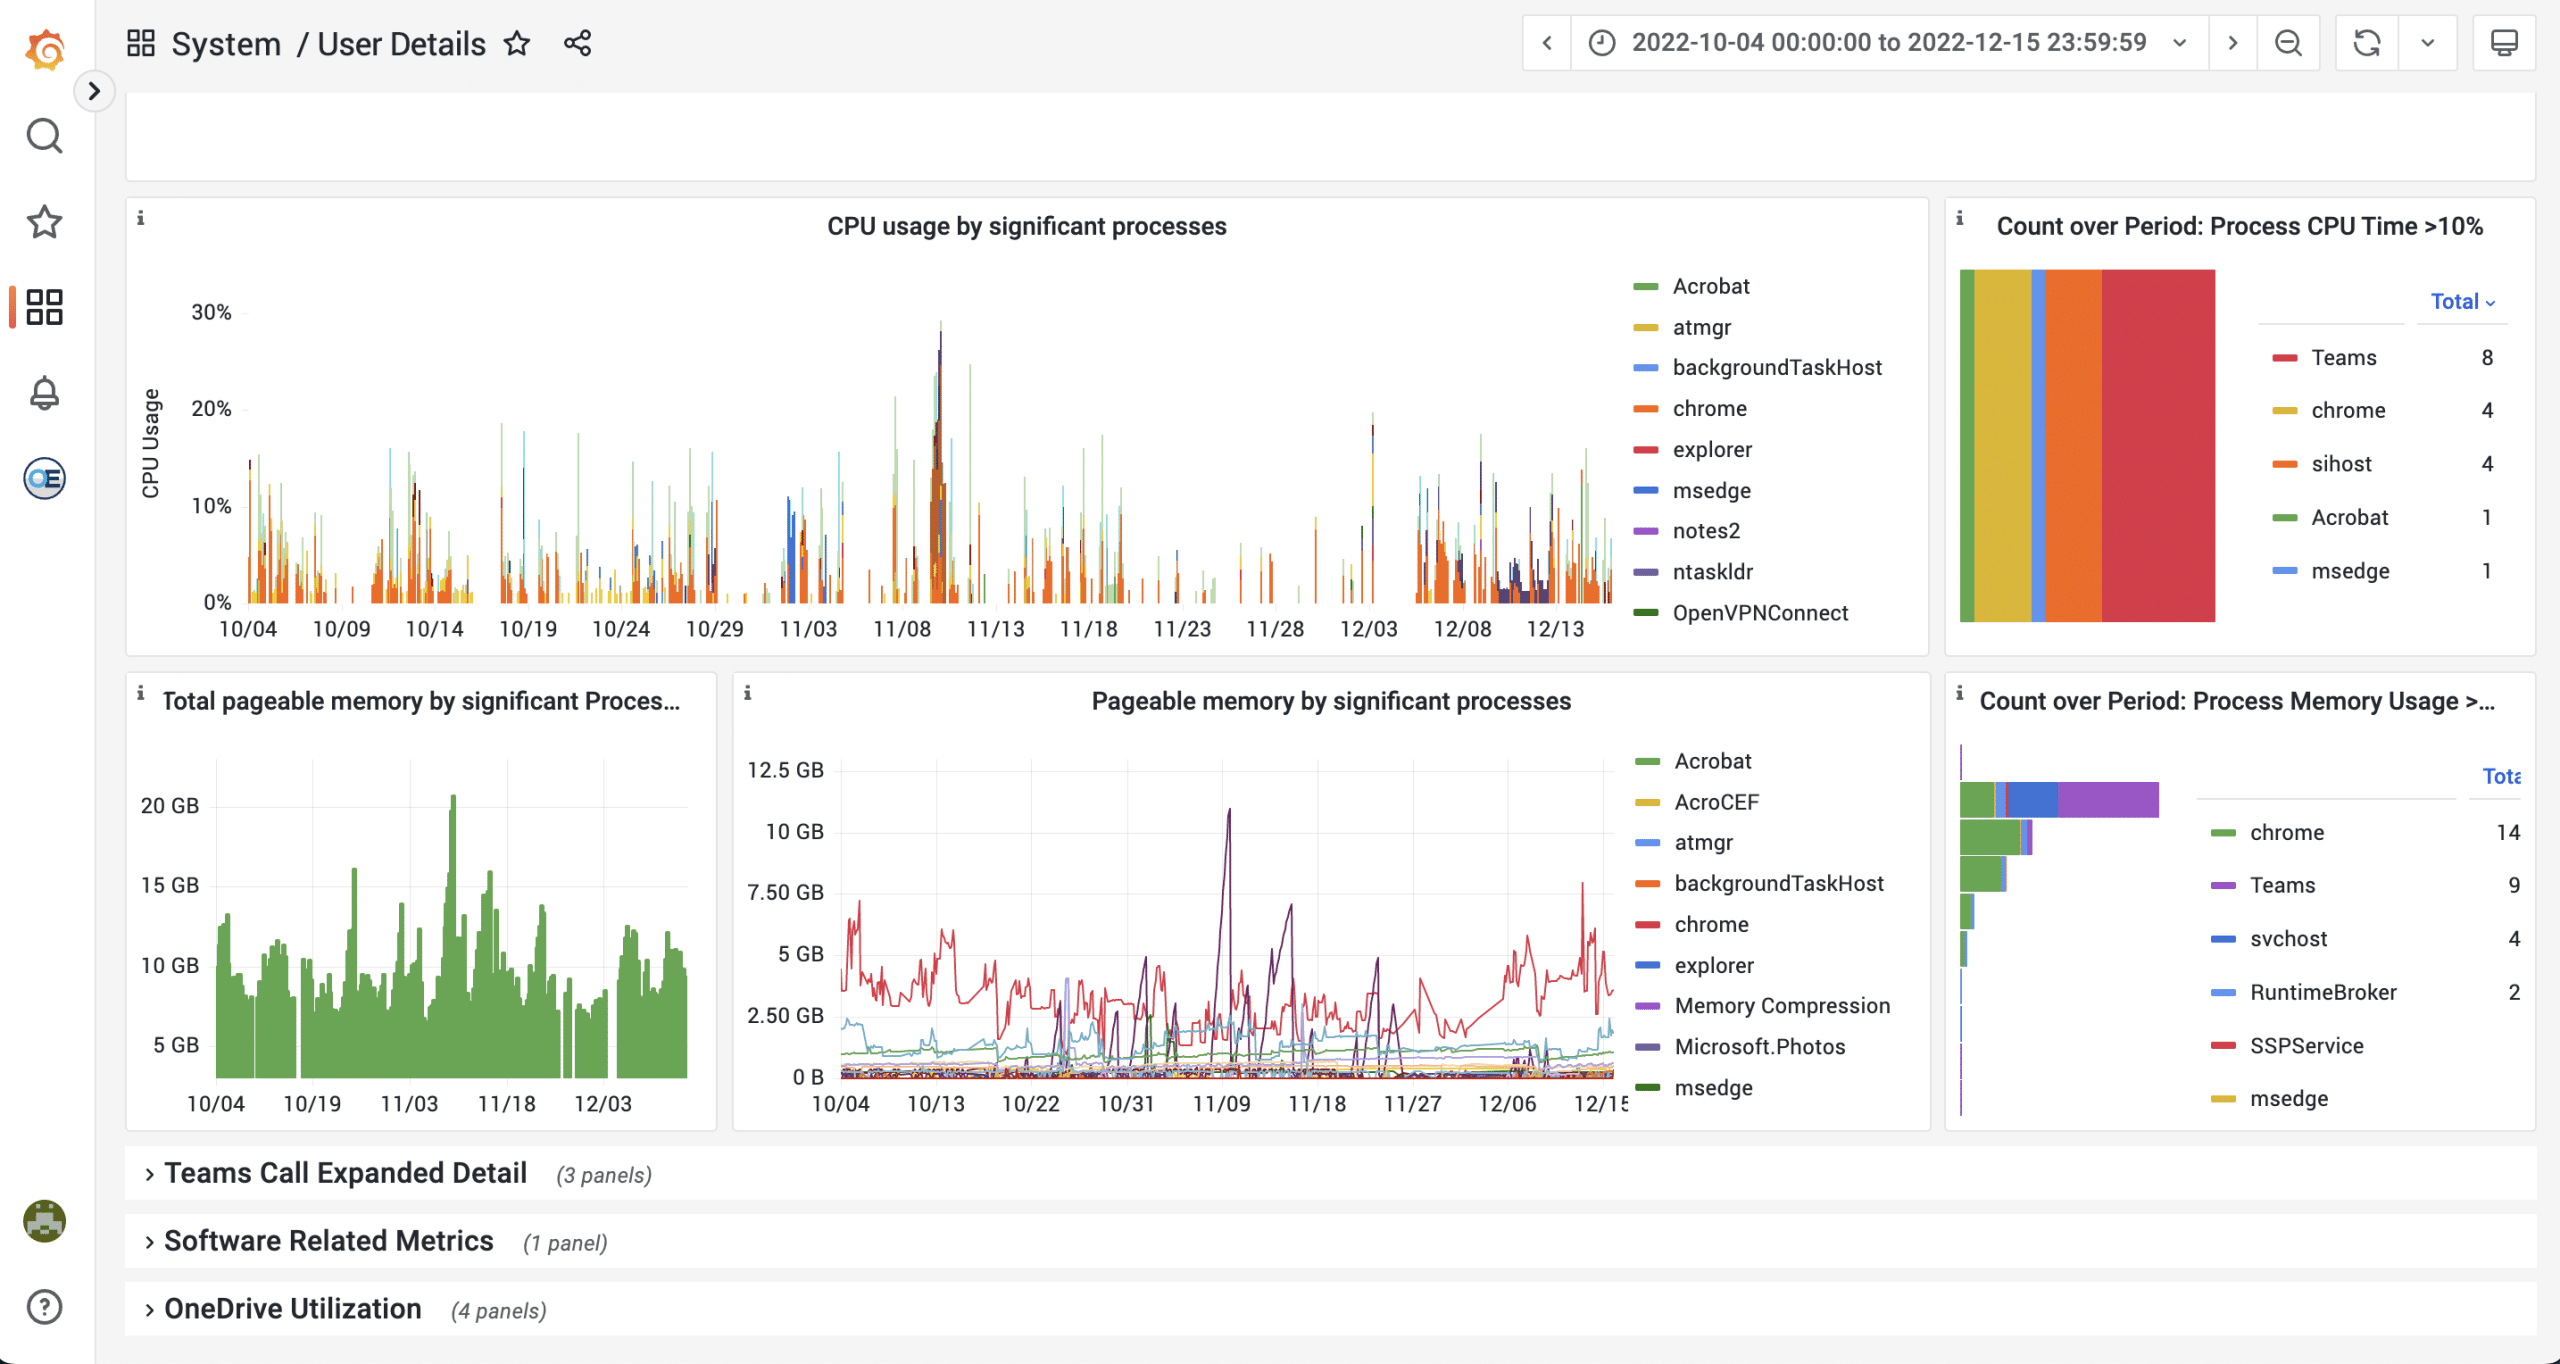
- On the “Users Details” page, zoom in on the processes and applications that were running during the selected time period. Look for evidence of processes that consistently use a high percentage of CPU and identify patterns or trends of high usage in pageable memory. Sometimes simply closing those applications may be an easy solution.
- Hovering over the “CPU usage by significant process” panel shows all processes listed by percentage. Examining the process percentages closely, there’s no indication of processes hogging the CPU.
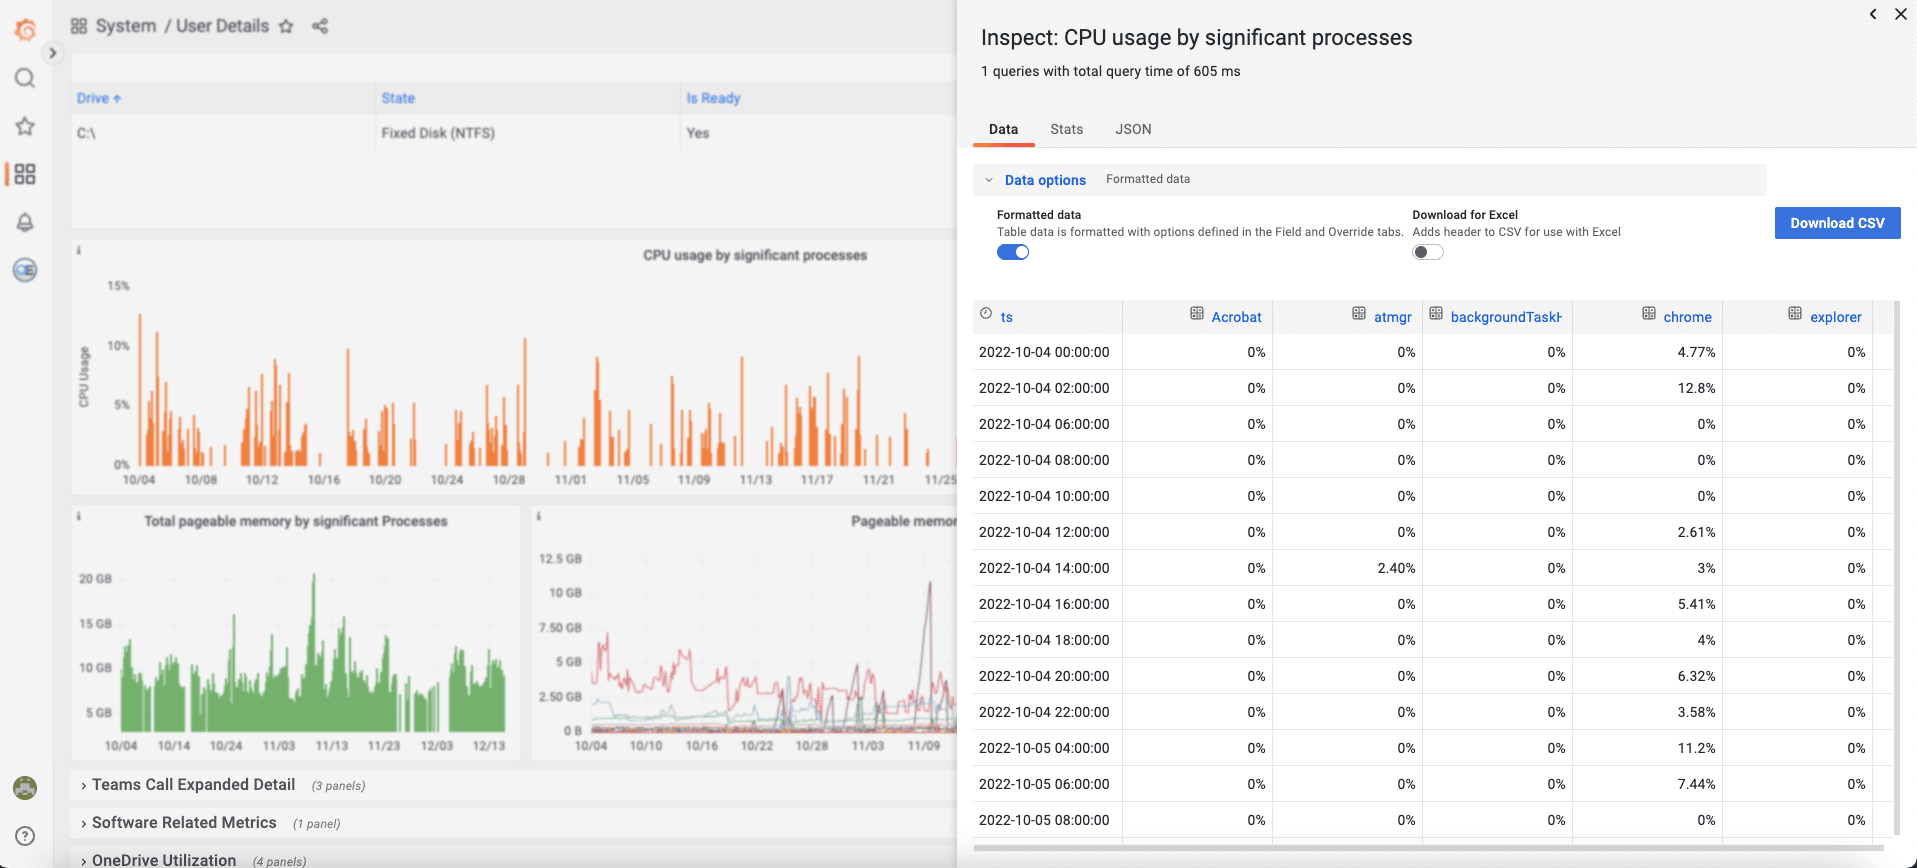
- Diving deeper into the CPU process data, click on the carat (^) beside the “CPU usage by significant processes title” and a menu will appear allowing the ability to inspect the data more deeply. The data is presented in an excel-style table. It can also be exported into an Excel spreadsheet for sorting and more.
From the table below, it’s evident that Google Chrome was one the busiest processes. However, scrolling through the time period (October – December), Google Chrome was only at an average 5 -6 % CPU usage.
Result: Nothing looks out of the ordinary with running processes or applications on the computer… On to suspect #3!
Suspect #3: Home Office Networking Issues
A common problem for many home office users, in hybrid workplaces, is with their local network performance. It’s an area that most organizations have little influence over as it is up to their employees to determine how their home network is set up.
Download and upload speeds are key factors. The case of Microsoft Teams calls which often use video increases the need for faster upload speeds to process. If users are too far away from their Wi-Fi router, or their cable modem doesn’t support the latest standards such as DOCSIS 3.1, then they could experience poor network performance and, in the end, poor Microsoft Teams calls with both audio and video.
To ensure there were no office hardware, modem or Wi-Fi router issues, it was verified that the router and modem are connected properly, the firmware is up to date, and all equipment is running up-to-date specifications (such as DOCSIS 3.1).
Using the OfficeExpert Client:
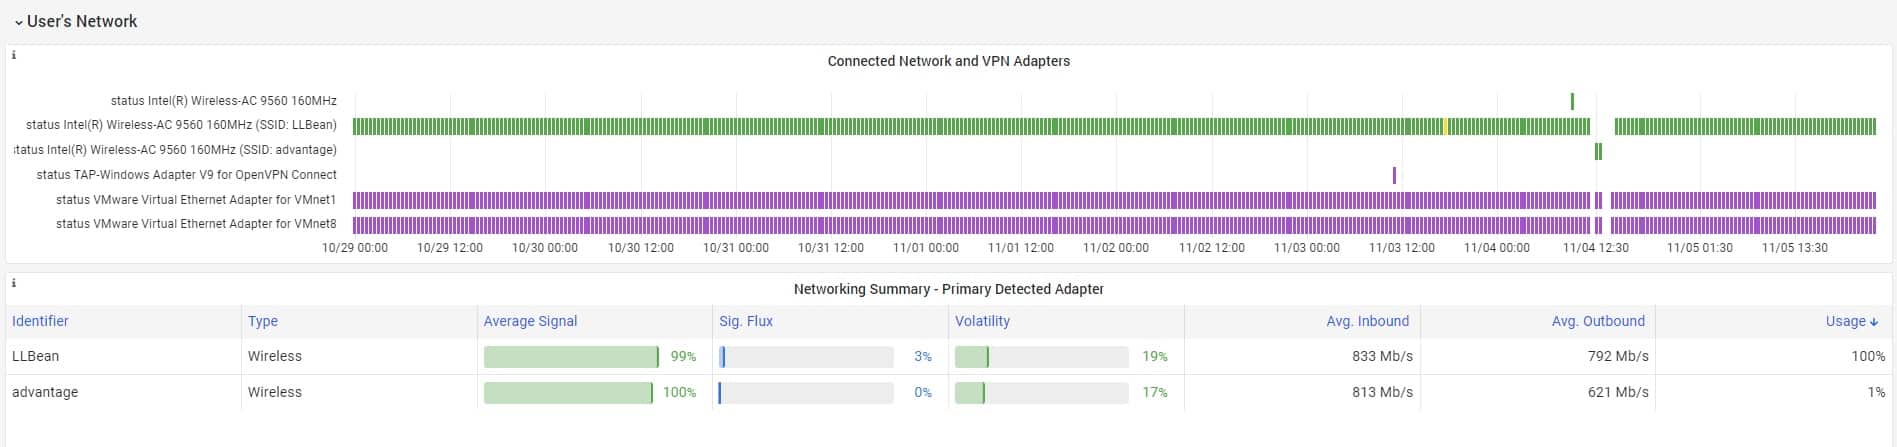
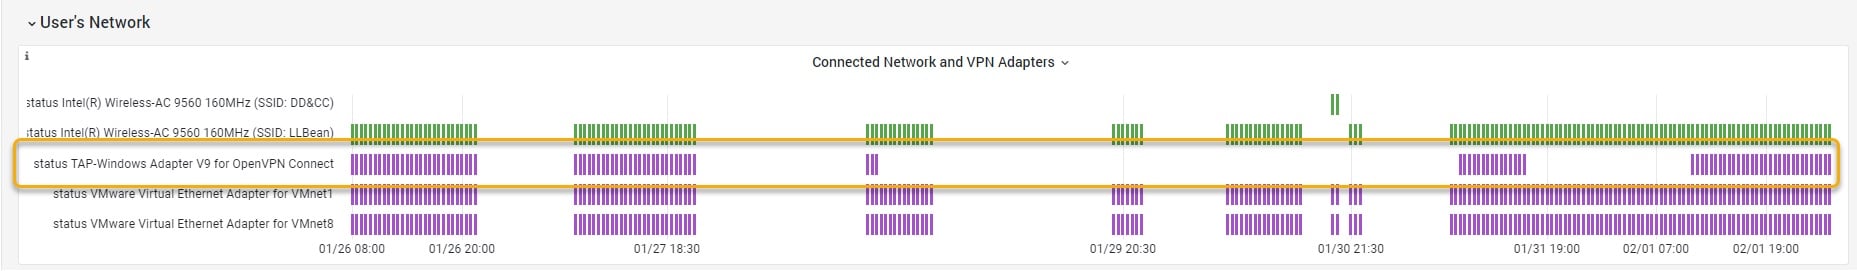
- Navigate to the “User’s Network” dashboard and focus on the “Connected Network and VPN Adapters panel.
- The presence of a color bar indicates that the adapters were connected during the selected time period. The primary adapter that is involved in routing traffic to the internet is SSID: LLBean.
For Wi-Fi connections, the signal strength is presented on the color scale mentioned above. The average signal strength for LLBean was green (good) and the “Volatility” was only a small percentage (19%). Volatility is the change between the negotiated speed of the wireless connection. The higher the percentage, the more chance that windows couldn’t communicate at the negotiated speed and had to drop to a slower connection. This was not the case with the “LLBean” wireless adapter.
- The next panel to investigate is “Wireless Network Strength”. Examining the Wi-Fi Signal strength and the Received Signal Strength Indicator (RSSI- the measurement of how well the device can hear a signal from an access point or router) indicates no issues with Wireless Network Strength.
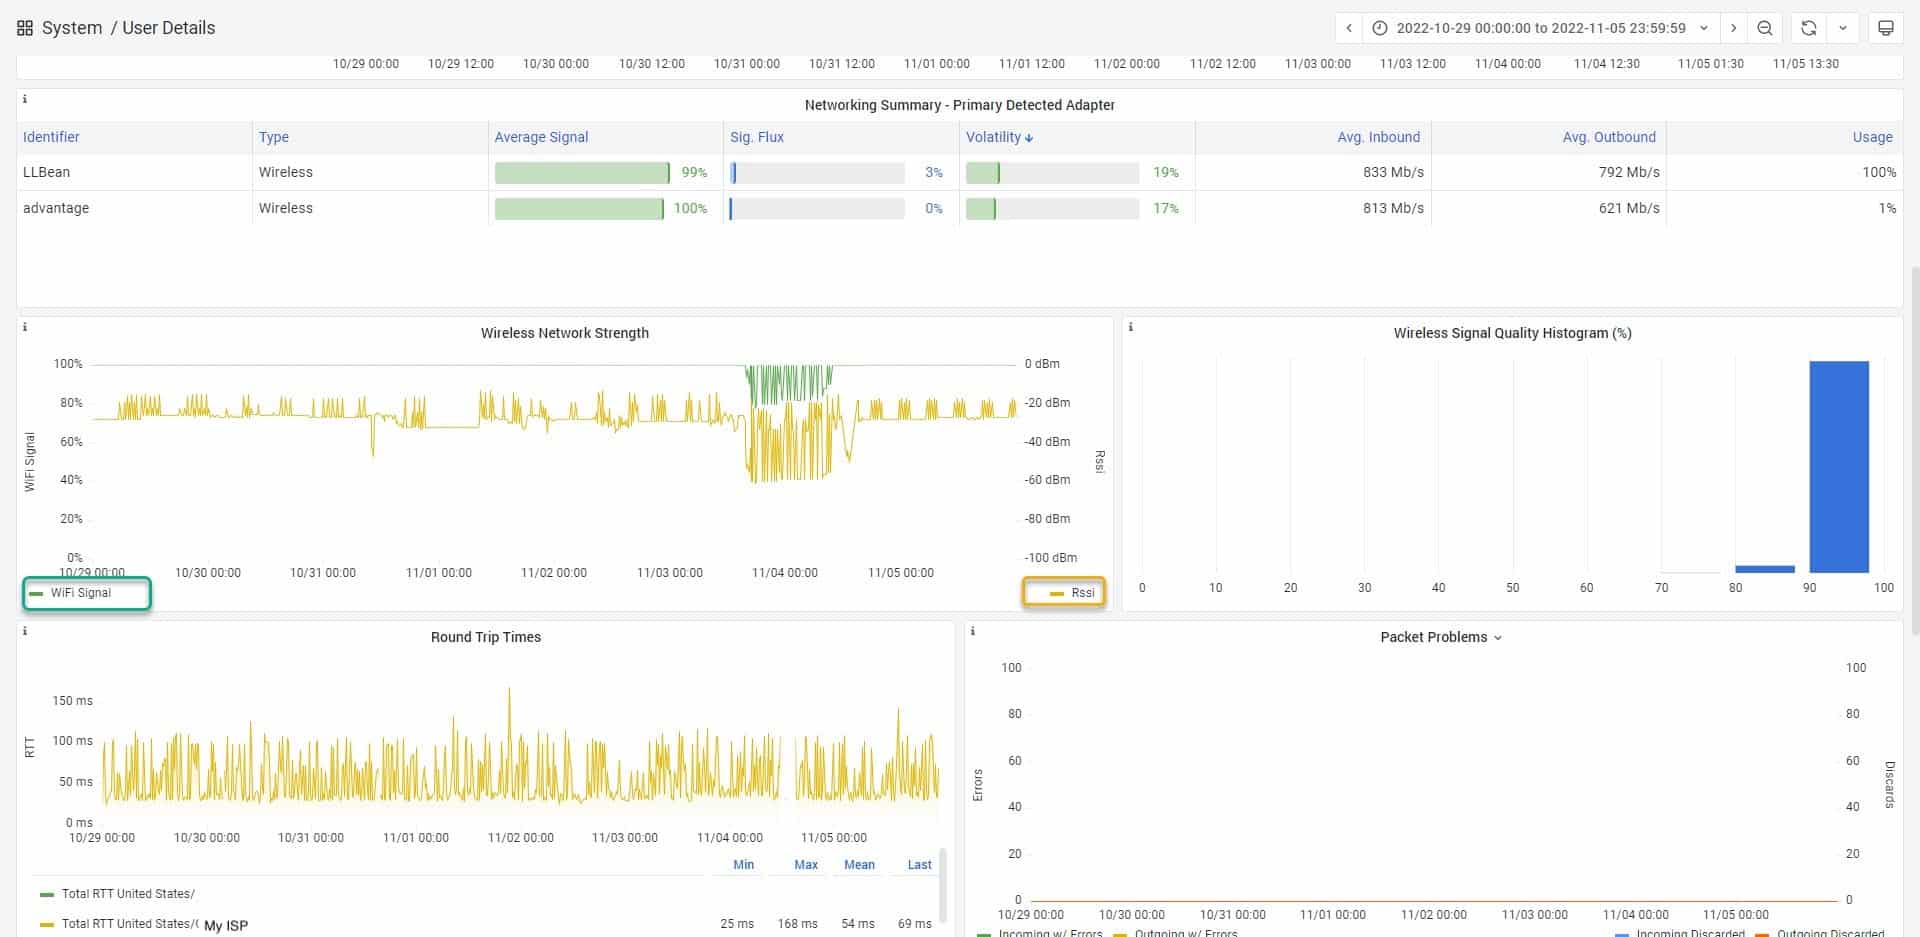
Result: The home office networking looks to be solid. The Wi-Fi signal is strong. The office router and modem are up to date with current firmware. On to suspect #4!
Suspect #4: VPN Software Routing for Network Access
When it comes to the hybrid workplace, VPN routing issues can be hard to pinpoint. Many organizations backhaul traffic from end-user devices to corporate networks to secure communications. It is not always the optimal path and can add extra latency for network traffic and Microsoft Teams audio and video user experience. If the VPN software is sending network traffic to a host server in a different geography (forced tunneling), it could cause cloud services activity to be processed through a far-away Microsoft data center. This can negatively impact call quality.
Using the OfficeExpert Client:
- Navigate to the “User’s Network” dashboard, focus on the “Connected Network and VPN Adapters”. This lists all adapters and shows if they are connected:
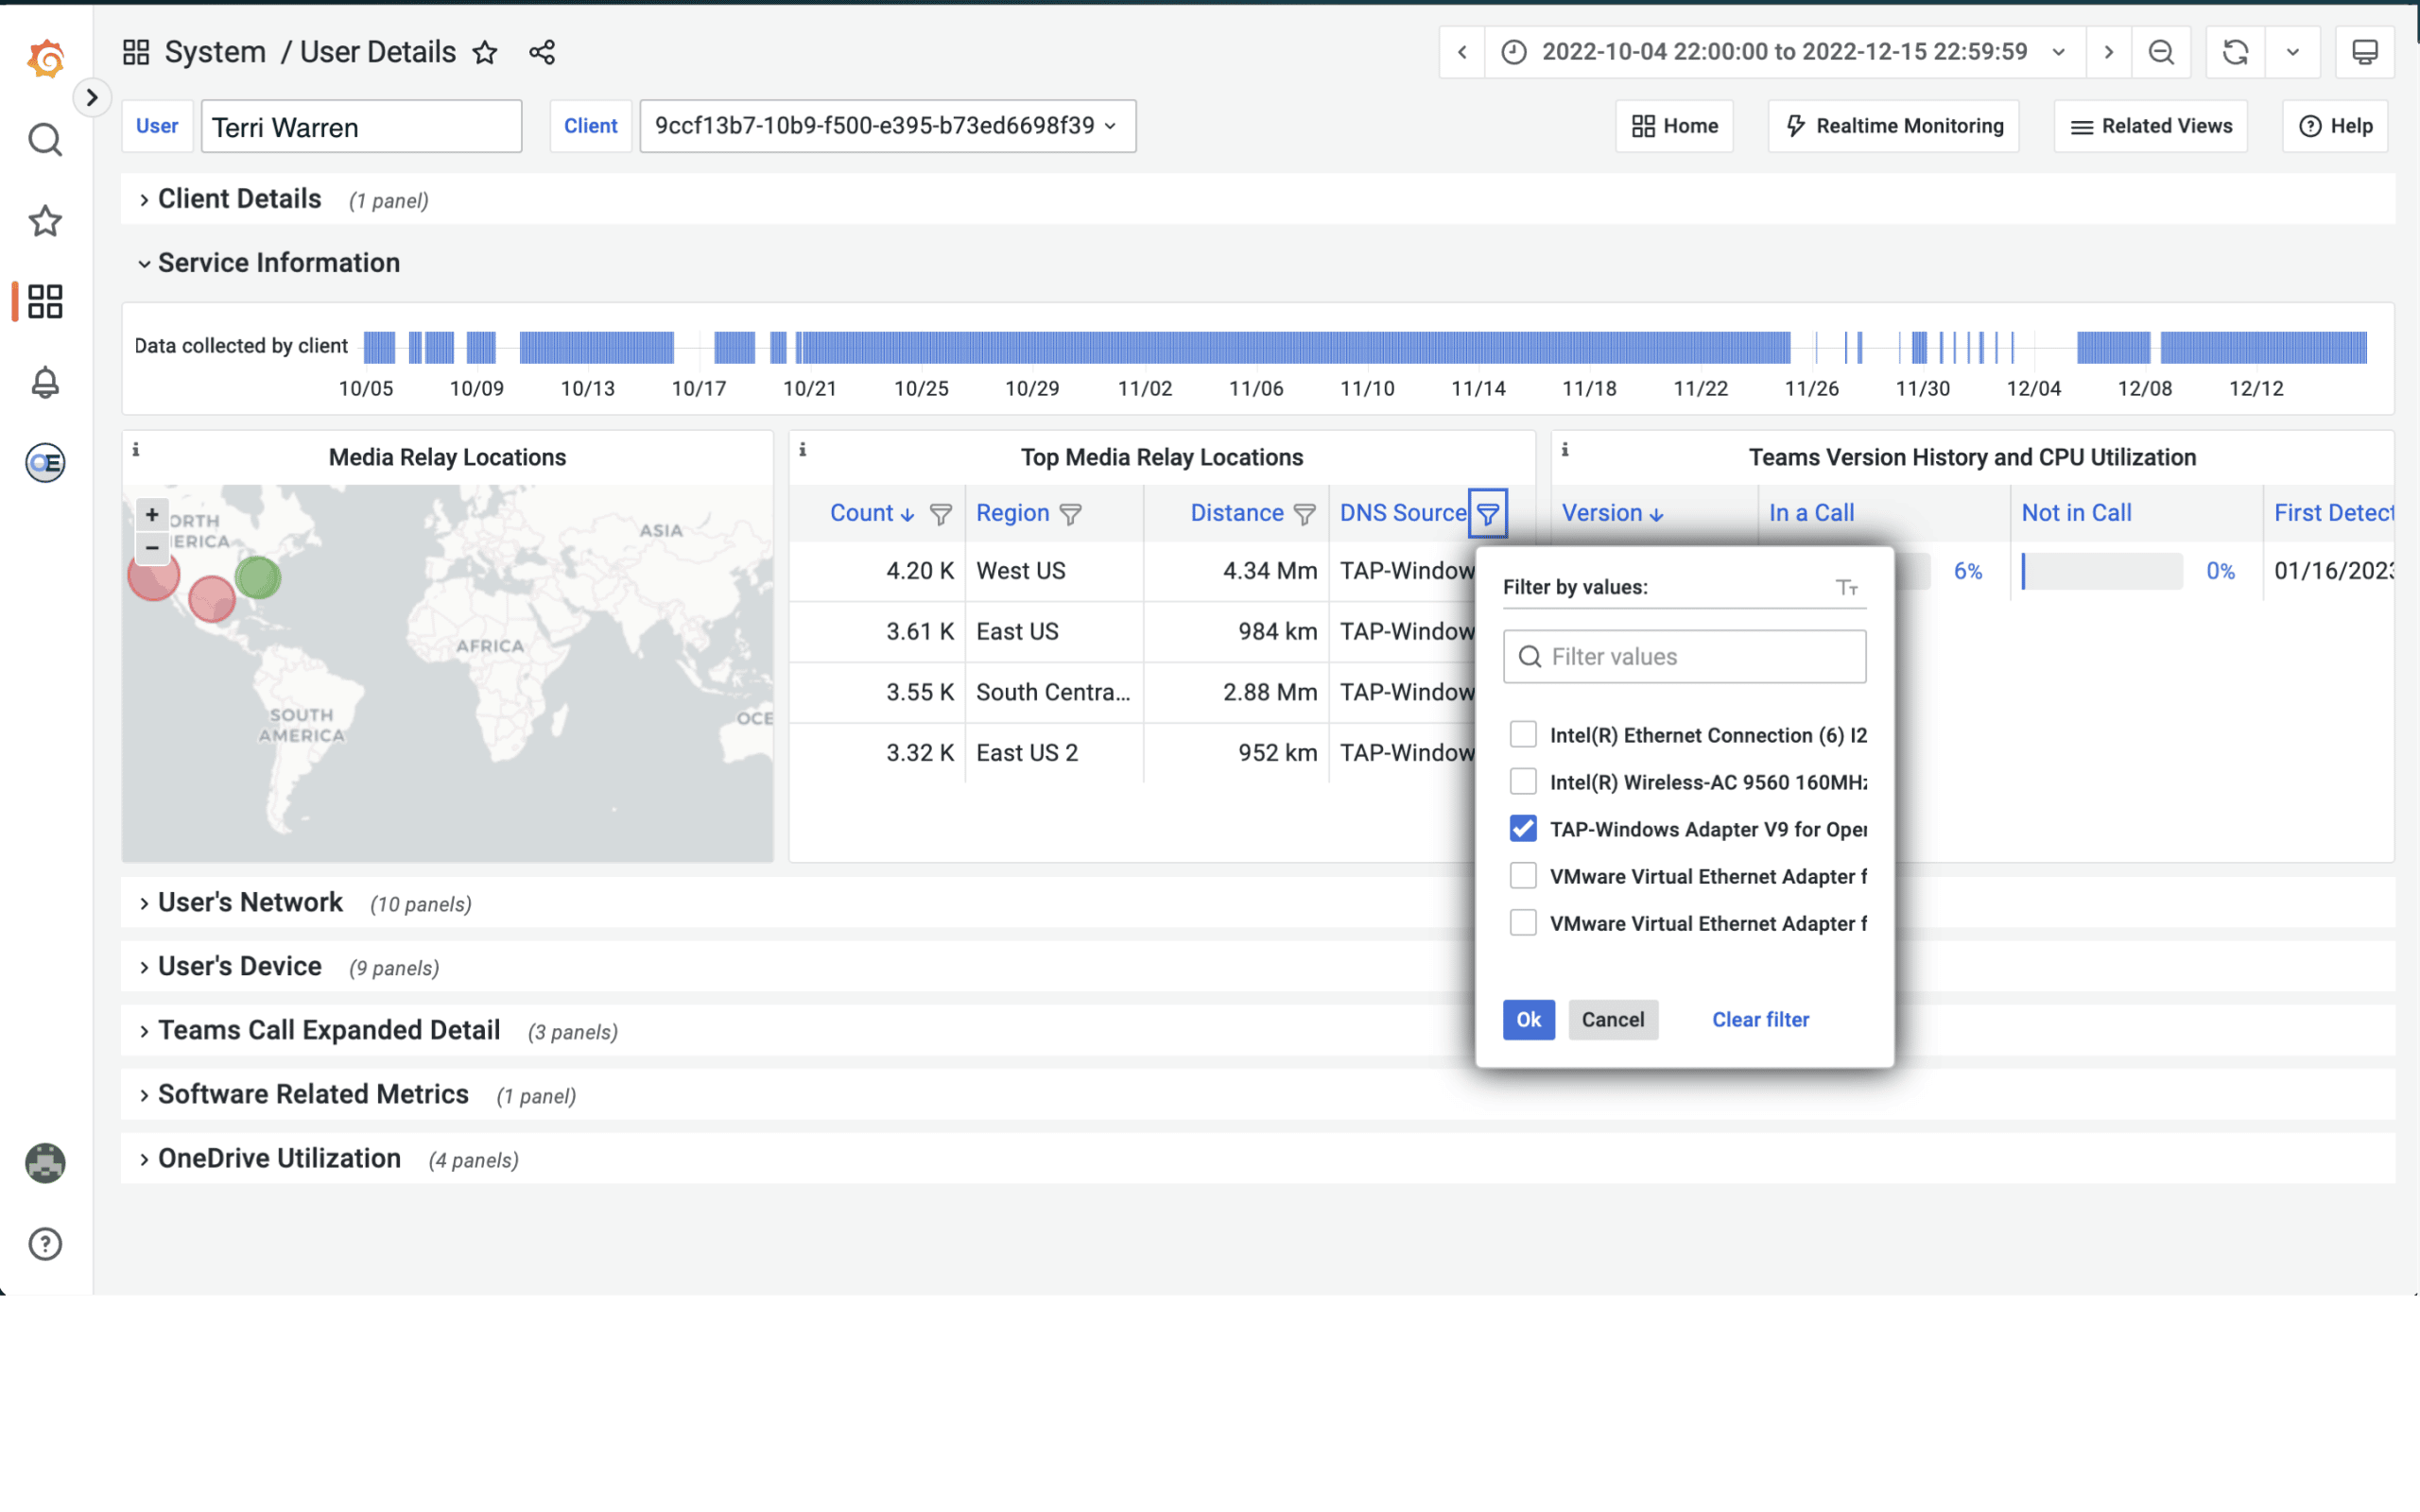
- Navigate to the “Service Information” panel (above the “Users Network” panel). Examine the Media Relay Locations (regions accessed by the user during this time period). Double-check that none of the hops are being forced to route back to the geographic location of the company’s on-premises network. This type of routing can negatively impact network performance.
- If forced tunneling is enabled, you may see this from the “Top Media Relay Locations” panel (filter by your VPN using the DNS Source for clarity) — see screenshot below.
Result: The VPN is not causing performance problems. On to suspect #5!
Suspect #5: Internet Service Provider (ISP)
In a hybrid workplace, a bad end-user digital experience can be attributed to the speed and performance of your ISP from your home office. Understanding factors like the ISP hop count, upload/download speeds and Round-Trip-Time (RTT) for remote users is crucial in identifying whether it is just poor call quality or poor network performance in general. RTT is a measure of latency — how long it takes for your device to send a message to a remote system (for instance the Microsoft network) and back again.
Using the OfficeExpert Client:
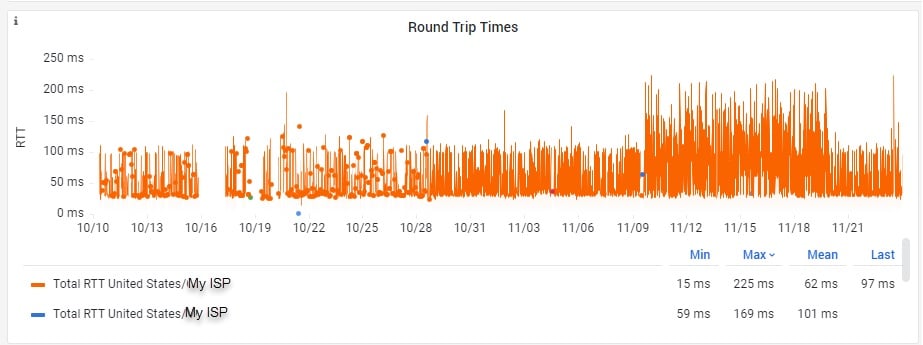
- Navigate to the “User’s Network” panel on the User’s Details page and zoom in on the “Round Trip Times” panel for the time period selected. It is immediately apparent that the RTT for the ISP are disproportionately high. This is a red flag. Notice as well that the RTT get much worse in November (up to over 200ms). The time period in the screenshot below indicates the days the network quality was going downhill and ultimately became completely unusable.
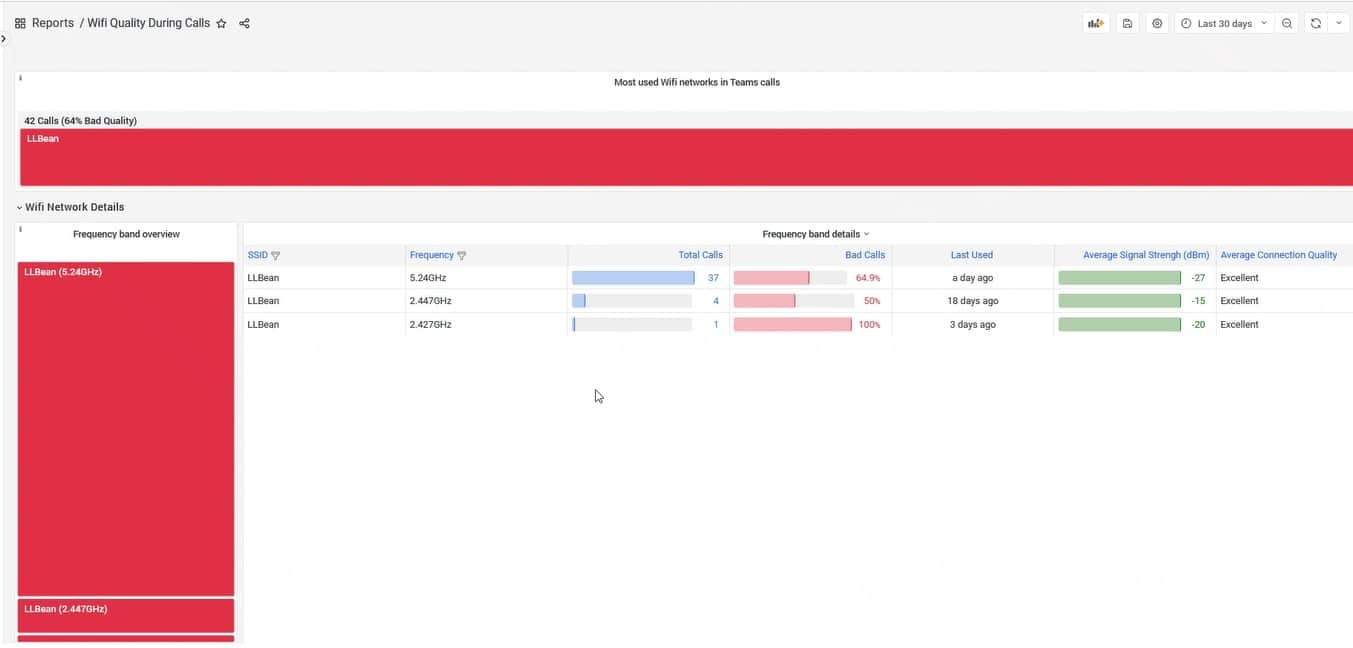
- Now that we are aware that RTT is an issue, take a look at the dashboards that illustrate the Microsoft Teams calls experience. Navigate to the “Reports” dashboard (see screenshot below), examine Wi-Fi quality during calls and you can see the Wi-Fi is working fine (as expected), but latency is a problem:
- At this point, there’s a strong indication that the ISP is the issue. Open the Reports/Routing Map dashboard to focus on the hops that are taking too long.
- One of the major symptoms experienced is poor Microsoft Teams calls. Looking at the hops, the network is taking too long to reach the Microsoft Cloud — to validate this, zoom in on the “ISP Trace Route” for teams.microsoft.com (the doorstep of the Microsoft Cloud for the Microsoft Teams experience). See screenshot below.
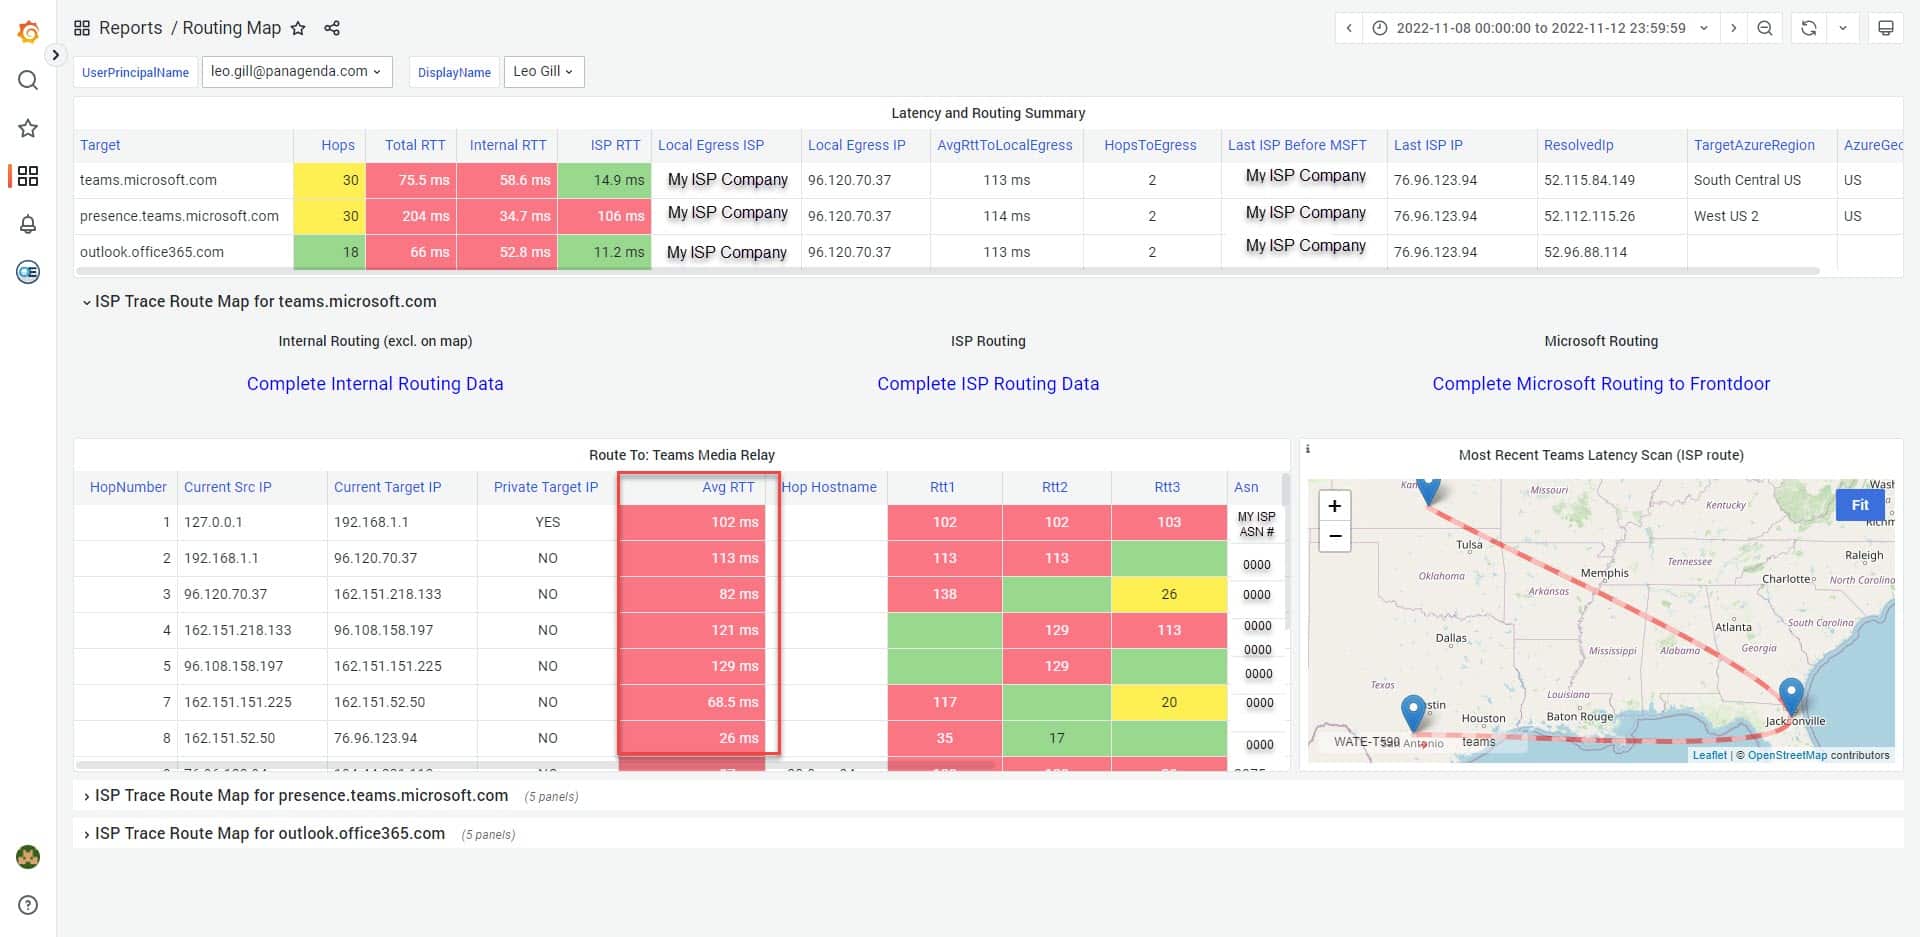
- ASN: Skip to the ASN column in the Routing Map dashboard and check the ASN (a unique identifier assigned to every network segment). Notice that the ASN for each hop (in the screenshot it is 0000) is identical throughout the column, and that ASN for each hop is correlated to the bad (red) Round-Trip-Time in the screenshot.
- Finally: Determine who owns this ASN using a well-known public tool (e.g. DNSChecker: https://dnschecker.org/asn-whois-lookup.php?). After doing so, it is evident that the ISP owns the network segment for each bad hop.
Result: Looking at all the above data, the problem seems to be with the ISP as all other tests didn’t show a problem.
The Aftermath
I immediately opened a ticket with my ISP for them to investigate the issue. Frustratingly, even with the above data in hand, it took no fewer than 8 visits from their technicians before they accepted the issue was on their end.The reason? Apart from my complaint very few others had called in their problems. Others had tried to report the issue to the ISP via chatbots — but this had proven too cumbersome and confusing, so most people eventually gave up and just suffered their slow and unreliable internet in silence.
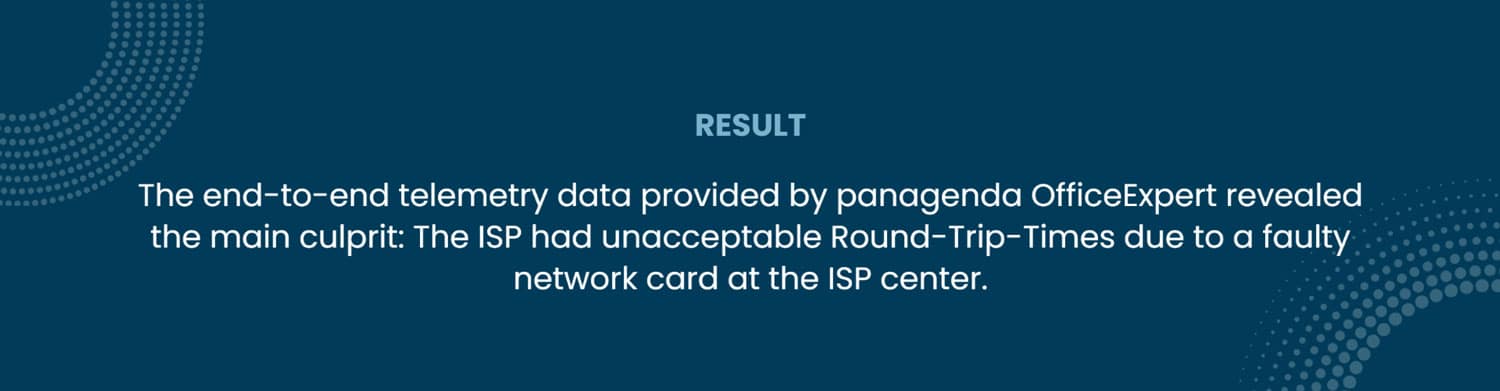
After a lot of investigation on their side, my ISP finally confirmed the problem: They were experiencing unacceptable latency and round-trip times on a trunk line running all the way back to the ISP center. There, upon closer inspection, they found the underlying cause: a malfunctioning network card in a node. A bad network card that was affecting 280 customers.
panagenda OfficeExpert had provided the telemetry data needed to point the finger squarely at my ISP. But the even bigger take-away here was that this experience clearly highlighted what IT organizations are suffering from industry-wide — that end-users really do suffer in silence. The ISP techs were not detecting issues between our houses and the outside cable lines. But persistence (and data) enabled us to push them to get the next level of help (maintenance technicians). These kept saying “if it were a larger issue we would be hearing from customers and we are NOT”.
Using my OfficeExpert client, I went house to house with my laptop, connecting to each home network. In each case the dashboards indicated excellent Wi-Fi connections but terrible RTT on the ISP’s network, an unacceptable scenario for someone working in a hybrid workplace.
Conclusion
In the reality of today’s hybrid workplace, IT operations groups are confronted with new challenges, one of these being the troubleshooting of Microsoft Teams user experience problems. In this blog post, we showed that you cannot depend on end-users to report issues to their IT helpdesk. To get to the bottom of M365 user experience issues, you have to rely on end-to-end telemetry data.
Your users don’t have to be part of the 64% end-users suffering in silence. Let a modern-day, digital experience monitoring solution guide you. To find out more about OfficeExpert and how it can help you proactively troubleshoot user experience problems for your M365 deployment, please visit our product page online or sign-up for a trial at https://www-test.panagenda.com/products/officeexpert.