
Teams helps people collaborate so they can innovate, and you can stay ahead of the competition. More and more people are part of the mobile workforce. Enabling them to collaborate while on the go ensures everyone is contributing to competitiveness.
Do you know if your mobile workforce really contributing to your competitiveness?
Your employees are changing – But perhaps not how you think!
The size of the mobile workforce continues to rise. Zug based IWG reports that 70% of people globally work remotely at least once a week.
This change in how we work is reflected how we access information. Mobile devices and their apps rule the day.
A snapshot of October 2019 from the website statcounter shows mobile devices including tablets accounted for 55.41 percent of web page views worldwide whereas desktop is at 44,59 percent. But, although the total percentage of mobile traffic is more than desktop, engagement is higher on desktop.
This is a problem. Time spent on mobile devices is up, but time engaged is down. How can companies ensure their employees remain engaged? How can the maximize their ROI?
Microsoft Teams is top-of-mind…but how to leverage it effectively
It´s no secret that implementation, adoption, and support of Teams doesn´t come at a low cost. In a recent Forrester Research study such cost was calculated for a fictive organization (based on results of 260 surveyed and 4 interviewed companies) with 3 500 information workers and 1.500 first-line workers to be $1.1 million over the course of the first 3 years. Twenty-five percent of annual Microsoft 365 license costs belong to Teams. They total more than $1.8 million. That’s a lot of money!
In spite of these high costs, many digital consultants, adoption managers and productivity analysts can’t answer questions about Teams’ usage and utilization rates. It has been almost impossible to find those answers. It’s a shame too. These could reveal changes in the way employees collaborate and if Teams really has positive impact on productivity.
What’s needed is answers to questions like these:
- How mobile are my users / departments / locations actually?
- Which operating system (device) is used?
- Is the use of a particular device, for example, so low because the user experience is so poor?
Organizational network analysis (ONA) solves the riddle
Look at the graphic below. It’s a simple thing, but it contains a ton of answers!
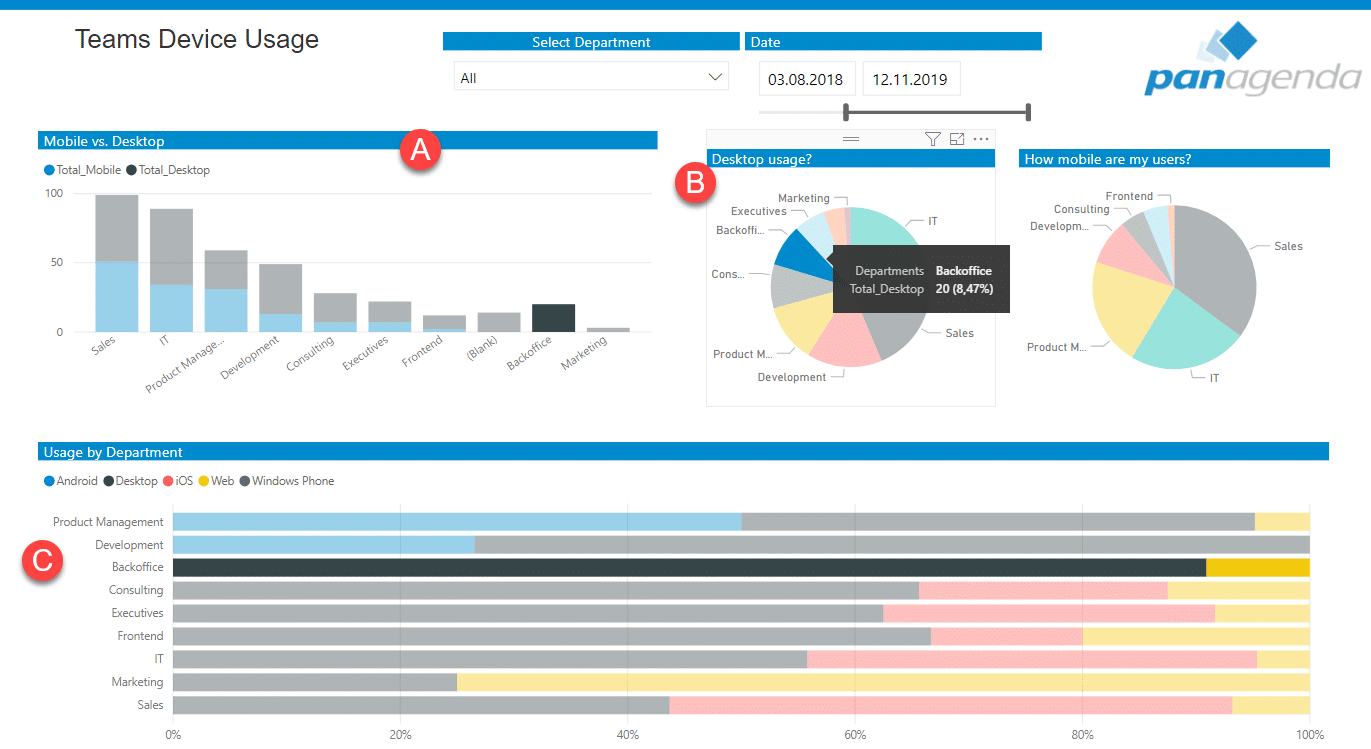
Let’s take the sales department as an example.
In diagram (A), you can quickly see as you would expect, they are the most mobile department in the organization. However, even within sales, 50% of the activity is not mobile. Why not? This is an area for further exploration to ensure the sales department is as engaged with your client base as would be expected.
Diagram (B) shows details about percentage overall Desktop usage is coming from the Backoffice department. Assume this department is a small one but at the same time they consume 10% of total desktop usage. This would indicate they heavily utilize MS Teams via the Desktop. A potential action (out of this data) could be that they can be excluded from training for mobile applications and no mobile hardware investment is required. This would save money in terms of both training and hardware.
Diagram (C) shows how employees are utilizing the range of different devices and operating system available to them. Knowing which department prefers which device for communication and collaboration allows you to ensure actual usage patterns align with your organization’s mobile connectivity strategy.
Deliver clarity, drive success, and achieve your goals
References
- CNBC quoting a report from Zug based IWG (https://www.cnbc.com/2018/05/30/70-percent-of-people-globally-work-remotely-at-least-once-a-week-iwg-study.html)
- Statcounter (https://gs.statcounter.com/platform-market-share/desktop-mobile-tablet)
- Forrester in a study commissioned by Microsoft (https://www.microsoft.com/en-us/microsoft-365/blog/wp-content/uploads/sites/2/2019/04/Total-Economic-Impact-Microsoft-Teams.pdf)
- Organizational Network Analysis (https://en.wikipedia.org/wiki/Organizational_network_analysis)